Navigation is the art of taking ships from one place to another when out of sight of land.
Pilotage is the art of taking ships from one place to another when land or navigational marks are in sight. Ships are navigated and piloted by the aid of charts, which are maps showing the coastline and the depths of water in different parts of the sea, the latter marked in metres (old charts were printed in fathoms and feet) as stated on the chart. These charts are made by the surveying ships of the Royal Navy and are published by the Hydrographic Department of the Admiralty or, in the case of New Zealand charts, surveyed and published by the Royal New Zealand Navy Hydrographer.
When within sight of land the position of the ship is usually obtained by taking bearings by compass of two or more prominent objects marked on the chart. These bearings are then drawn on the chart in pencil. The point where the lines cut is the position of the ship.
When out of sight of land the position of the ship is obtained by observations of heavenly bodies with a sextant.
The essential equipment required for coastal navigation consists of a compass, charts of the localities to be visited, parallel rules and dividers. In order that this equipment can be used to the best advantage, a thorough understanding of both compasses and charts is necessary.
Compasses
Two types of compasses are used at sea, namely, the gyrocompass and the magnetic compass, and the principles on which they work are entirely different.
The gyrocompass is mechanically and electrically operated from the ship’s electric power supplies; it is very accurate.
The magnetic compass is operated by the magnetism of the earth.
The magnetic compass consists of a card attached to a float contained in a watertight bowl. To the underside of the float, magnets, usually a pair, are fitted. These magnets provide the directional property of the compass and when horizontally suspended point to the North magnetic pole.
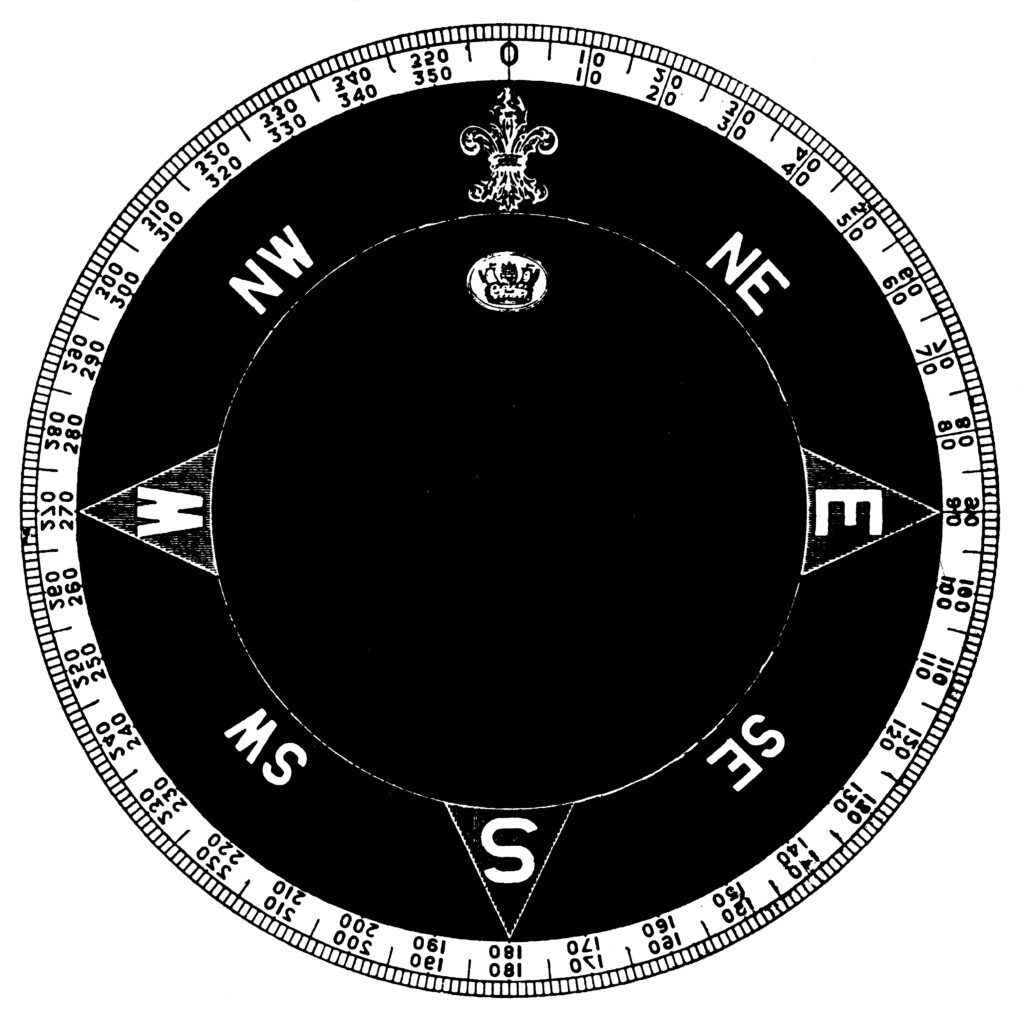
The card, which is of various diameters according to the size of the compass, is fitted to the top of the float. The card is marked in degrees from one to 360, usually in ten-degree divisions. North is indicated by 000, East by 90°, South by 180°, and West by 270°.
The card is fitted on to the float so that a line from 000° to 180° through the centre of the card is parallel to the magnets. In the centre of the floats a small jewel, usually an agate, is fitted and in the centre of the bowl an iridium pin is fitted. The bowl is filled with a mixture of two parts of distilled water and one-part clear alcohol.
The function of the alcohol is to lower the freezing point of the liquid. This allows the compass card to sit lightly on the iridium centre pin and the agate is fitted to reduce friction to a minimum. The main function of the liquid is to dampen the oscillations of the card and so give it a “dead beat” property. This means that when the card is deflected it will take up its direction position usually after three oscillations.
A dry card compass takes ten to fifteen oscillations to come to rest, and due to vibration in power driven craft, the card would be continually oscillating to a degree that would make the compass practically useless.
The compass bowl is fitted with a lubber line so that the direction of the ship’s head can be indicated by the compass card. The bowl is also fitted with a diaphragm to allow for expansion and contraction of the liquid due to changes in temperature.
The compass bowl is fitted with gimbals so that the card maintains as near a horizontal position as possible when the craft is under way. The suspension points of the outer gimbal ring should be in the fore and aft direction.
Preferably the compass should be placed in the centre line of the ship, so that a fore and aft line from the centre of the compass is in line with the keel. If it is not on the centreline the compass should be so fitted that a line through the centre of the card and the lubber line should be parallel with the keel. The compass should be fitted so that bearings can be taken to the best advantage.
In small ships it is not always possible to take bearings with the steering compass. In such cases use can be made of a hand bearing compass fitted with a sight vane and prism. When using this type of compass the navigator should stand clear of any metallic objects, and in steel craft should stand as far as possible clear of the hull.
Compasses cannot be checked by comparing one with the other unless they are at least four feet apart.
In earlier designs the compass card was divided into 32 points and each point was divided into half and quarter points. No doubt this system of division of the card was adopted because 32 was evenly divisible the greatest number of times.
Being able to name the 32 points in their correct sequence was known as “Boxing the compass”. The disadvantage of this notation of the card was that a point measured 11¼°.
Consequently, the more convenient 360° notation became universally adopted.
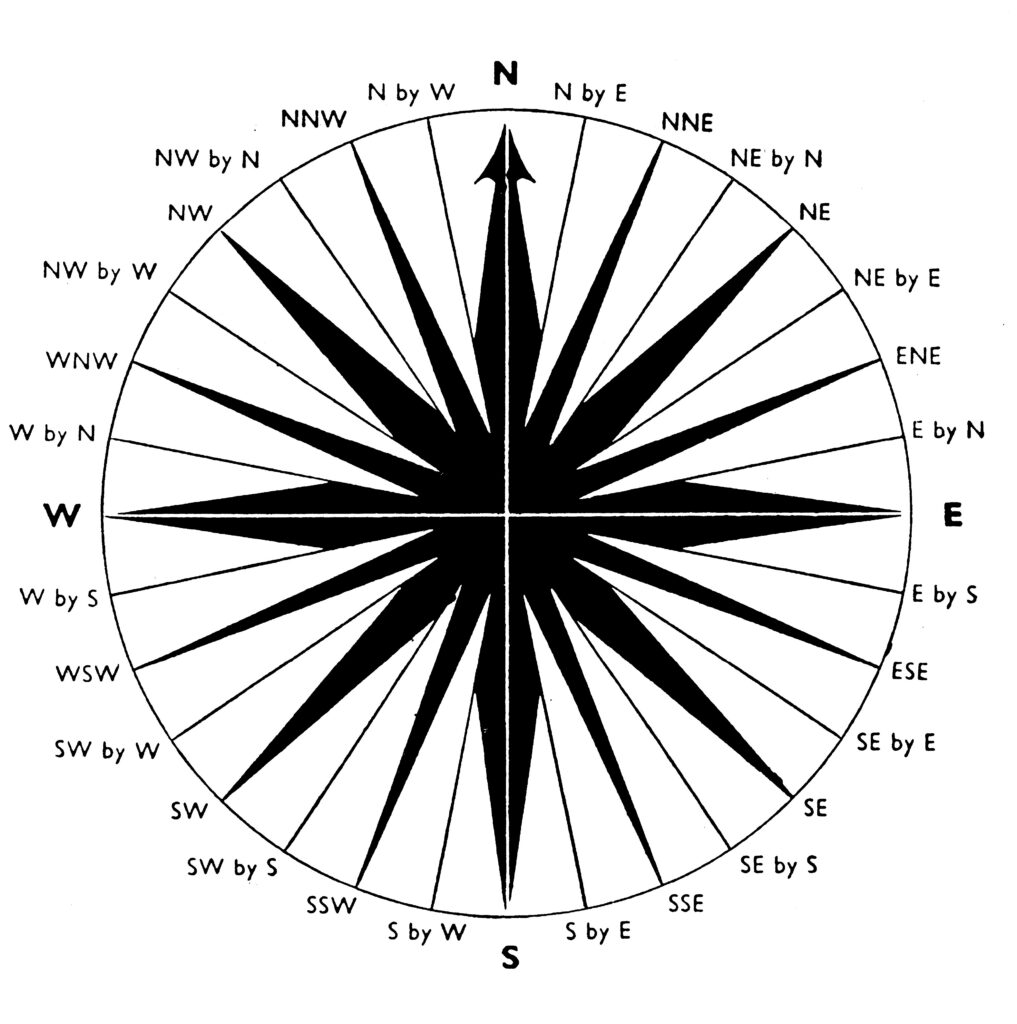
On most compass cards the eight points are shown N, E, S and W, known as the cardinal points, and N.E., S.E., S.W., and N.W., known as the quadrantal points.
When using the compass, the navigator should express direction in the 360° notation. For example, Northeast would be expressed as zero-four-five. Southeast as one-three-five. Southwest as two-two-five and Northwest as three-one-five. As an aid to memory, it will be seen that the sum of the figures used to express the cardinal and quadrantal points in the 360 notations add up to nine.
The simple theory of the directional feature of the compass is as follows: The earth is considered to be a huge magnet with a North and South Pole, and lines of magnetic force flow from one pole to the other. The magnetic poles do not coincide with the geographical poles so that the lines of force do not flow in a true North and South direction. A magnet such as a compass needle, free to move in a horizontal direction will align itself with these lines of force which appear to flow irregularly in a North and South direction. The compass will therefore indicate magnetic North.
Variation and Deviation
The difference between the True North and Magnetic North is known as the variation of the compass. Variation of the compass is the number of degrees the North point of the compass needle is deflected from True North. When the needle is deflected to the right it is known as Easterly Variation and when to the left Westerly Variation.
Variation of the compass is not a constant quantity and has different values in all navigable parts of the world and it is also subject to periodic changes. The variation of the compass at Auckland is at present 18°E and is increasing at the approximate rate of 1° in ten years. This is marked on the compass rose on the chart of an area. It need not cause Sea Scouts great concern, however, as long as they remember to use the variation given on the nearest compass rose on the chart to their position.
A second disturbing influence on the compass is caused by magnetism in the ship or its fittings in the vicinity of the compass. This is known as deviation of the compass and is named in the same way as variation. Deviation is due to the lines of magnetic force being distorted by the presence of magnetic material in the vicinity of the compass. These lines of force when flowing take the line of least resistance and flow through magnetic material easier than through the atmosphere. That is why compasses is small steel craft give so much trouble.
 If the compass is fitted in a steel wheelhouse the lines of magnetic force flow around the walls of the wheelhouse. This weakens the magnetic field in the vicinity of the compass and makes the compass more susceptible to the deviating effects of the iron in the ship. Deviation can however be corrected by introducing an opposing magnetic field by placing magnets around the compass in a fore and aft or athwartship position.
The combination of variation and deviation which is found by adding like names and subtracting unlike names is known as the error of the compass and it is the amount the compass needle is deflected right or left from true North. For example, in a ship heading 063° the deviation was found to be 3°W variation 18°E the error will be 15°E. The true course is found by adding Easterly error or subtracting Westerly error. The true course in this example is therefore 078°.
Deviation of the compass varies as the course varies, and if it exceeds 5° the compass should be adjusted.
Deviation of the compass is also an unstable quantity and should be checked frequently. Various practical methods of doing this will be explained when dealing with the use of charts.
Deviation in small wooden boats is negligible and is usually considered to be non-existent. (Beware of steel drop keels.)
This rhyme may help (to find True North or to obtain True Bearing from Magnetic):
Variation East, Compass Least (Less than True).
Variation West, Compass Best (Greater than True).
Charts
A chart is a map of a locality which shows all features essential to the navigator to fix the position of the ship and to proceed from one place to another by the shortest route and to avoid dangers which may exist.
Navigational charts are drawn on what is known as the Mercator projection so named after its inventor Gerhard Mercator, a Flemish geographer. In any plane projection of a curved surface such as the earth some distortion must occur. The Mercator projection is a plane projection and shows the meridians as straight lines running in a North and South direction and the parallels of latitude as straight lines running in an East and West direction.
Only at the equator is a degree of longitude equal to a degree of latitude, viz 60 nautical miles. The degree of latitude remains constant from the equator to the pole while the degree of longitude varies from 60 nautical miles at the equator to zero at the poles. At Auckland the length of a degree of longitude is 48 nautical miles. The importance of this to the navigator is that distance must never be measured on the longitude scale, but only on the latitude scale on the side of the chart.
To compensate for the distortion of the meridians the distances between the parallels of latitude are increased progressively as they recede from the equator to the poles. Consequently, when measuring distance the latitude scale on the edges of the chart should be used abreast of the locality over which the distance is being measured.
Charts are to a large degree self explanatory but much of the information is set out in an abbreviated form. Space does not permit a description of all the abbreviations used but a catalogue chart describing and explaining these abbreviations can be procured from chart agents and this should be obtained by anyone who wishes to make intelligent use of navigational charts.
Perhaps the best way to illustrate the use of charts is to make an imaginary passage from Auckland to Whangaparapara Harbour, Great Barrier Island. Assuming the navigator to be a stranger to Auckland, the need would be for three charts to cover the intended passage.
The charts required will be Auckland Harbour No. 5322 Approaches to Auckland No. 532 and Bream Tail to Kawau Is. Point No. 522.
Get these charts and the parallel rules and on the charts plot the course to take. This area has been chosen because it is a popular one for boating and will include most of the features found on any chart and will also demonstrate most of the things one needs to know for basic harbour and coastal navigation.
The Passage
Using chart No. 5322 departure is taken off the end of the Eastern Tide Deflector. The chart indicates that the end of the tide deflector has three fixed lights, red, yellow and red vertically displayed. From the departure position the course is set to pass the buoy showing a quick flashing green light, to port. The true course is 076°. The compass course should be 076° -19° (variation) = 057°. An approximate check on the compass is thus obtained.
On this course it is noted that the ebb tide has a rate of two knots at springs. The direction of the flood tide is indicated by a feathered arrow and that of the ebb tide by a plain arrow. No arrow is shown for the flood tide because in this vicinity the rate of flood tide is irregular due to the Eastern tide deflector.
On the port side the navigator will see two green lights and then two red lights, all fixed. In daytime these beacons can be recognised by their white triangular topmarks. These mark the sides of the prohibited anchorage which is the track of the telephone cable from Auckland to the North Shore.
On the starboard bow will be seen Bean Rock light, flashing with various white and red sectors. The group consists of three flashes every eight seconds, is 14 m high above high water ordinary spring tides and is visible 15 miles.
The white sector indicates the channel down the harbour. The red sector indicates foul ground from the Sandspit off Devonport to Rough Rock which is indicated by a pillar buoy with black and yellow horizontal stripes. This type of buoy indicates a middle ground obstruction with navigable water on either side safer to the east.
The next arrow white sector indicates the channel out of the harbour for medium draught ships. Deep draught ships would cross the white sector into the green sector to pass between a green conical showing a green light every four seconds and a red can buoy showing a flashing red light every four seconds
The next white sector indicates the channel to pass Browns Island to the Motukorea Channel. The next red sector indicates the foul ground between Browns Island and Achilles point. Deep draught ships would continue on in the green sector until reaching the line of leading lights which indicate the deepest part of the channel.
The front leading light is on a red and white beacon with a white light flashing each second. The back one is a yellow beacon with a white light flashing every four seconds. The direction of this line is shown as 142½°30′. True. This indicates that all bearings are given from seaward. The magnetic bearing would be 142½° – 19° = 123½°. The magnetic course out of the harbour on this line would be 123½° + 180° = 303½°. When crossing this line, the lights should be brought right astern and a check on the compass should be obtained.
When proceeding from the flashing buoy off Devonport to the buoy showing a flashing green light on the edge of the white sector off Bean Rock light, the various contour lines of the bottom are well illustrated on this chart.
Depths
The 10-metre line is shown as a continuous line with light blue shading, and it is interesting to note the deep hole between North Head and Bean Rock with the greatest depth 29.8 m at low water. The five-metre line is a continuous line with dark blue shading. The shoreline at low water when composed of sand is shown as a green area.
Off Cheltenham Beach figures such as 0.8 indicate that the bank dries to a height of 0.8 metres at low water.
Comparison of the shoreline shown on the chart off Cheltenham and off Rangitoto illustrates the difference between a sandy shore and a rocky shore. Rocks with less than two metres of water over them are indicated by black crosses + . Rocks awash at low water are indicated by a cross with a dot in each section
The coloured shading of charts now adopted shows up the various contour lines very clearly.
NOTE: All new charts are printed with the depths in metres instead of fathoms and feet. To get a good understanding of the symbols on charts you should refer to the booklet. Symbols and Abbreviations New Zealand Charts.
Voyage Continued
As most of the essential features of a chart have been explained, continuation of the projected voyage with such further explanations as is necessary can now be resumed.
After passing the flashing buoy off Devonport a course 055° True, 036° Magnetic is steered to pass the flashing green buoy leaving it on the port side. Rounding this buoy, a course is set to pass two cables off Rangitoto Beacon which exhibits a flashing red light every 12 seconds. This course is 352° True or 333° Magnetic. The distance on this leg of the course is 2.6 miles, so the speed can be checked after making allowance for the tide.
A short cut around North Head to Rangitoto could have been taken but the distance is .35 of a mile shorter and the saving of time would have been approximately three minutes at a speed of eight knots.
Transferring
Off Rangitoto Beacon on the port hand is a buoy showing a red light flashing two every five seconds.
The position of Rangitoto Beacon has been reached by making use of the facilities provided for safe navigation in entering and leaving the harbour as shown on the chart.
The position, two cables off Rangitoto Beacon, is now transferred to chart No. 532, Approaches to Auckland.
The contour lines are as shown on the first chart used with the addition of the 20-metre line.
The only feature on this chart which has not already been explained is shown by the wavy lines off Cape Colville. These indicate tide rips or overfalls, and the area should be avoided by small craft when there is any wind, particularly when the wind is against the tide.
In order to continue the voyage, it is now necessary to indicate the position on the chart in terms of latitude and longitude. Use is now made of the parallel rules which are used for transferring lines of direction from one place to another on a chart. From the position off Rangitoto Beacon use the rules to indicate an East and West line to the left-hand scale of the chart. This line will show the Latitude of this position to be 36°47’S.
This portion of Chart No. 532 shows the course 042° laid off from a position two cables off Rangitoto Beacon, and the two bearings taken of Tiri Light in doubling the angle on the bow (22° and 44°), and the two bearings (45° and 90°, or abeam) for a four-point bearing. Both these show the distance off the light and are used to fix the ship’s position. A study of this portion of the chart will also reveal many of the features mentioned in the article.
Similarly, a line so produced in a North and South direction to the bottom scale of the chart will show the Longitude to be 174°49’E.
Using chart No. 3565, Bream Tail to Kawau Is., find the Latitude and Longitude of a position at the entrance to Whangaparapara Harbour. This will be found to be Latitude 36°15.7’S, Longitude 175°23.7 ‘E.
![]()
To find the course and distance between the two positions the following simple calculation is necessary:
| Lat. Rangitoto | 36.47S |
| Lat. Whangaparapara | 36.15.7S |
| Diff. Lat. | 31.3N |
| Long. Rangitoto | 174.49E |
| Long. Whangaparapara | 175.23.7E |
| Diff. Long. | 34.7E |
Divide these two quantities by 10, gives D. Lat. 3.13 D. Long. 3.47. Using the edge of the chart, from one of the parallels of latitude measure 3.13 miles down and using the scale of longitude measure 3.47 minutes of longitude along the parallel. Join the two points so found to form a triangle. The angle is the true course and the length of the line measured between the two points multiplied by 10 will be the distance.
The true course is found to be 042° and the distance 42 miles. Use of this simple calculation will impress on the navigator the difference between the latitude scale and the longitude scale of the chart.
It may be found that the use of parallel rulers in a small ship at sea and in cramped conditions will be somewhat awkward. It is useful to have a square protractor by which courses can be measured wherever they cross North and South or East and West lines on the chart.
Having found the course and distance of the intended trip, revert now to chart 532. From the position off Rangitoto Beacon draw the true course 042°. If the compass is correct the compass course will be 023° (042° — 19° variation).
Proceeding along this course two simple and useful problems in coastal navigation can be illustrated.
The first is known as “doubling the angle on the bow”. It will be found that when on course at Rangitoto Beacon, Tiri Light (group flashing in two groups every 30 seconds) will be 22° on the port bow or bearing 002° by compass. When it is 44° on the port bow or bearing 340° by compass, the distance run between these two bearings is the distance off at the second bearing, 6.2 miles.
The second problem is the “four-point bearing” problem which is also doubling the angle on the bow. In this problem the light is observed when it is 45° on the bow, the distance run from this bearing until it is abeam or 90° on the port bow will be the distance off when abeam, 4.2 miles.
The same two problems could be used when approaching Channel Island which shows a two-group flashing light every 12 seconds, visible 20 miles.
A further check on the position can be obtained when Channel Island light appears over the horizon. The distance off will be approximately 20 miles to starboard and the angle on the bow will be 120. The distance run when the angle is 240 will be the distance off at the time. A further check can be had when it is 480. It will be seen from the chart that on this part of the course the tide will have little effect. Its rate is but it is substantially in the same direction as the course.
On the course, after passing Tiri Tiri Light the ship will pass in the range of Flat Rock Light, a white light flashing seconds on the port side. When the position is with Island abeam to starboard, the problem should be transferred to Chart No. 3565.
Channel Island light is passed four miles to port and on the last leg of the voyage allowance will have to be made for the tide which runs at a rate of 1 to 2 knots athwart the course.
If making the port on a dark night the course could be altered to bring Channel Island light and Mt. Hobson, the highest peak on the Gt. Barrier, in transit. A course steered on this line will bring the ship to the entrance of Whangaparapara Harbour.
On the voyage out of Auckland we have looked at chart symbols and seen the use of doubling the angle on the bow and the four-point bearing to find the vessel’s position and distance off an object. Let us look at some of the more usual fixing our position.
The most common way to determine a vessel’s position is by cross bearings (position lines) of two shore objects; our position is where these bearings cross. It is much better to use three bearings where possible, and this usually gives a triangle cross known as a cocked hat; the vessel’s position is the centre of the cocked hat.
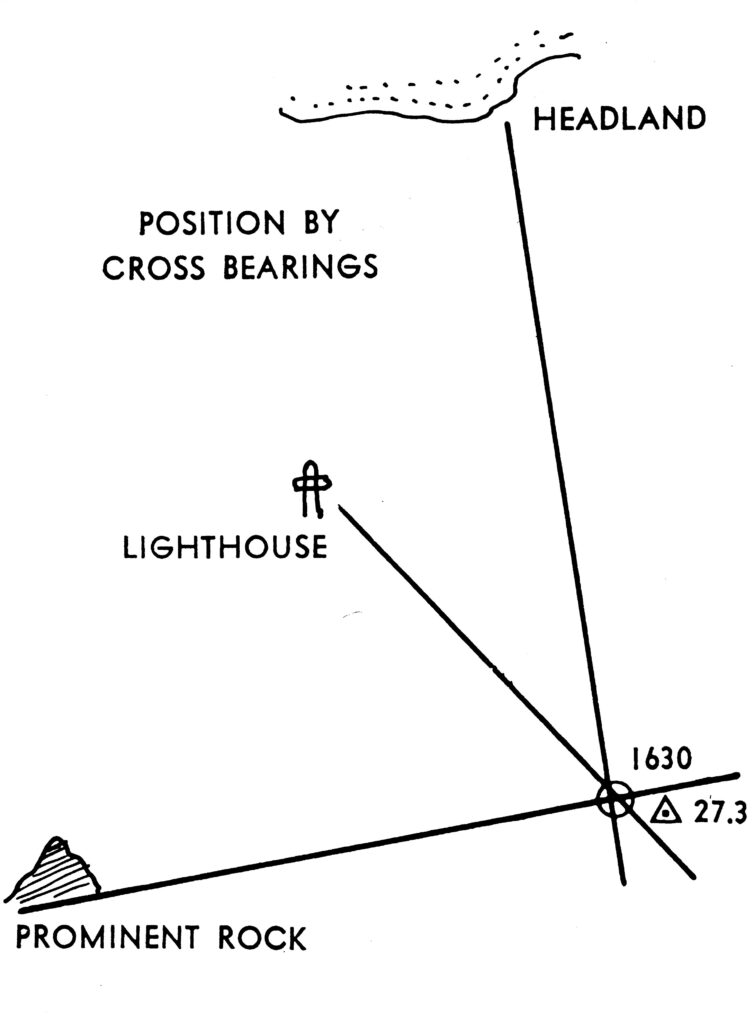
Remember that all compass bearings must be corrected for magnetic error (deviation and variation) and only true bearings are laid off on the chart.
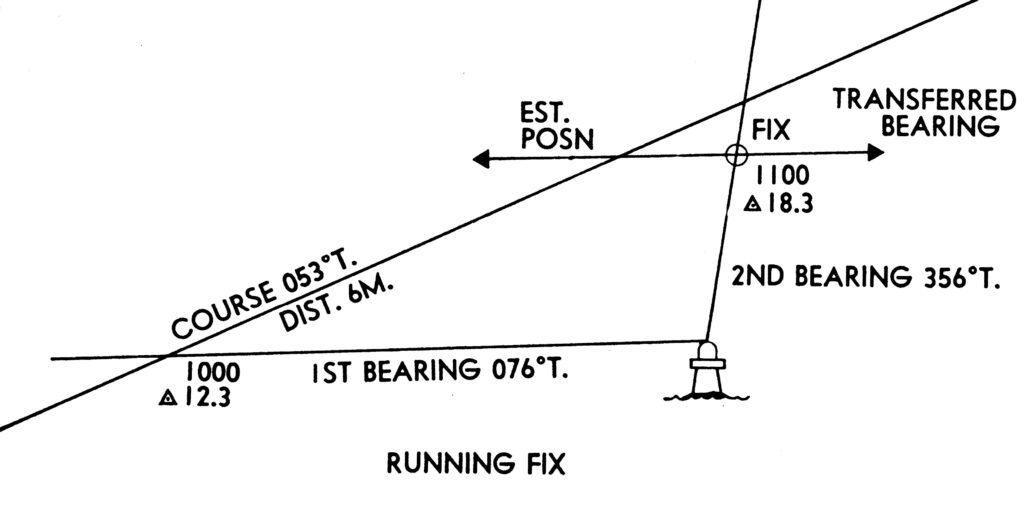
When proceeding along a coast where you can only see one landmark at a time you can still find your vessel’s position using a running fix. First you obtain a single bearing of a known shore object; we know that we must be somewhere on this line. The next step is to obtain a second bearing of the same object or another object sometime after the first bearing. Now we lay off the course and distance we have steamed from a point on the first bearing to give us an estimated position. The final step is to transfer the first bearing through the estimated position and where the transferred bearing cuts the second bearing we of have the vessel’s position.
 Sometimes we have to allow for the effect of tides or currents known as “set” on our vessel. We can get the information about the direction and the speed of the tide from the tidal information on the chart and the New Zealand nautical almanac and tide tables.
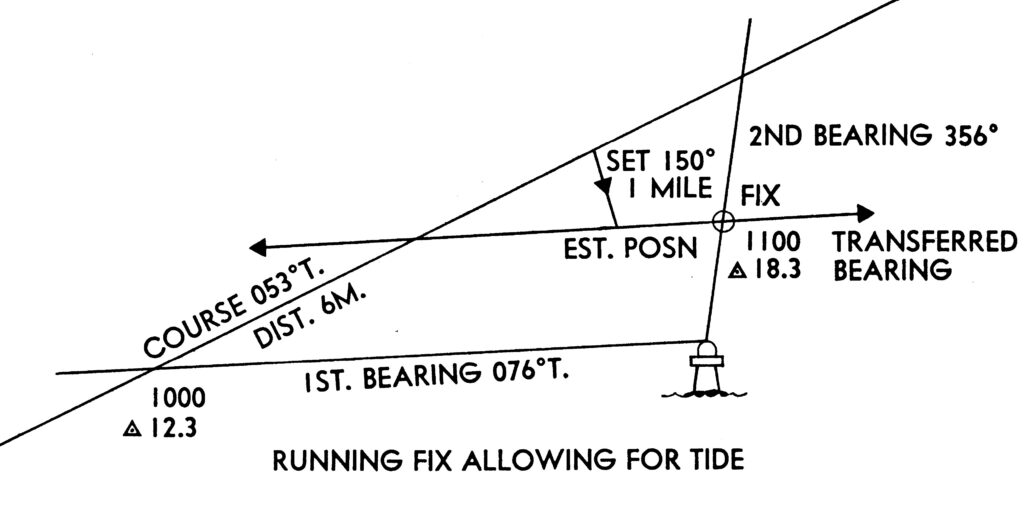
In the running fix problem, we would lay off from our estimated position the set and drift of the tide for the period between the two bearings, and when we transfer the first bearing it is transferred through the new estimated position which takes into account the effect of the tide.
When sailing along the coast we often have to steer a course which counteracts the effect of-the tide to keep the vessel on a good course. This course is calculated using the true course and true direction of the tide to find the true course, then it is converted to a magnetic compass course. To find the course to steer to counteract tide you lay off on the chart the true course and speed for one hour then from the position you arrive at lay off the tide for one hour BUT in the opposite direction to which it is heading. Then stop and make sure you have done it correctly.
 Another force which pushes our vessel off course is wind causing leeway; we do not treat leeway the same as tide. The amount of leeway affecting the vessel is estimated and the correction applied directly to the compass course.
The navigation in this chapter is intended as an introduction to the subject and Scouts should consult recognised textbooks when studying navigation.
Tides
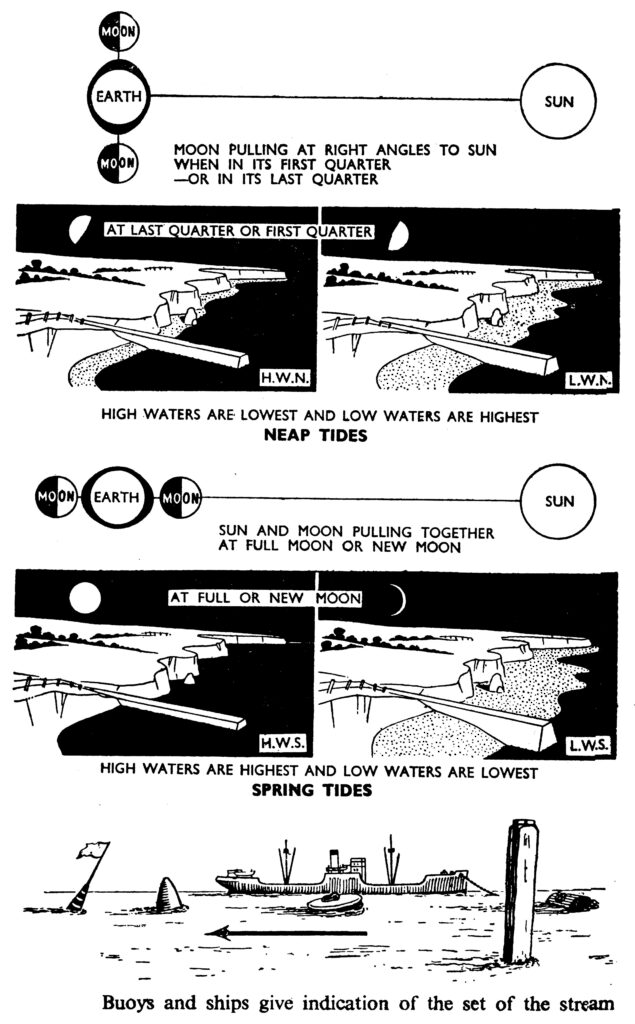
The tides are the daily rising and falling of the sea caused by the action of the sun and moon in attracting the water towards them. Generally speaking, around New Zealand it will be found that after the tide has reached its lowest level, at “low water”, it then rises for about 6¼ hours until its highest level, at “high water”, after which it falls during another 6¼hours to the next low water, and so on. The amount in metres the tide rises from low water to the following high water is called the “range” of the tide.
There are two high waters and two low waters every 25 hours, high water occurring about 50 minutes later each day.
The heights and times of successive tides, which vary from day to day, are to be found in the tide’s tables included in the New Ealand Nautical Almanac. The time and height of the tides is predicted for every day of the year for a number of different ports.
It will be found that the rise and fall of tide is greatest about the time of new and full moon (spring tides) and least 7½ days later in each case (neap tides).
The depth of water, or “sounding” shown on a chart, in metres (old charts in fathoms) is the depth below what is known as “chart datum”, and above which the height of the tide is measured. Chart datum is nearly always below low water springs so that we know the depth of the water will never be less than that shown on the chart.
As a rough guide to calculating the height of the tide at particular time a six-hour tide may be expected to rise or fall approximately:
1/12 of its range in the first hour
2/12 of its range in the second hour
3/12 of its range in the third hour
3/12 of its range in the fourth hour 2/12 of its range in the fifth hour
1/12 of its range in the sixth hour
Tidal Streams
The rise and fall of the tide is accompanied by a horizontal movement of water called the “tidal stream”, which flows in and out of harbours and along the coast.
A rising tide is accompanied by the ingoing stream, called the “flood stream”, and its presence is indicated on the chart by a small, feathered arrow. A falling tide is accompanied by the outgoing stream called the “ebb stream”, indicated by a plain arrow on the chart.
The tidal stream runs stronger where the water is deeper or the channel narrower. The stream runs fastest during the third and fourth hours of the tide, and this stream reaches its maximum rate at spring tides.
Soundings
Large vessels these days are equipped with Echo Sounders, an electronic device which measures the length of time it takes a sound to travel from the ship to the bottom and return. By knowing the speed at which sound travels through water, and measuring the time taken, the depth is obtained. Ask to see the Echo Sounder when next your Leaders arrange a ship visit.
Smaller vessels may rely on a hand lead line to obtain soundings. To obtain soundings up to a speed of 10 knots a line of 50 metres in length is used, and the lead is a three kg to seven kg tapered bar hollowed at the bottom for arming with tallow if it is desired to obtain a sample of the bottom.
The lead is marked at intervals throughout its length as shown in the illustration. The leadsman heaves the lead ahead of the ship, noting the depth when the line is straight up and down.
Some lead lines are still marked in fathoms. You can make a metric one by putting cords with knots in them at the metric marks, e.g. six knots at the six-metre mark. At the 10-metre mark you have a leather tag with holes to mark the tens.
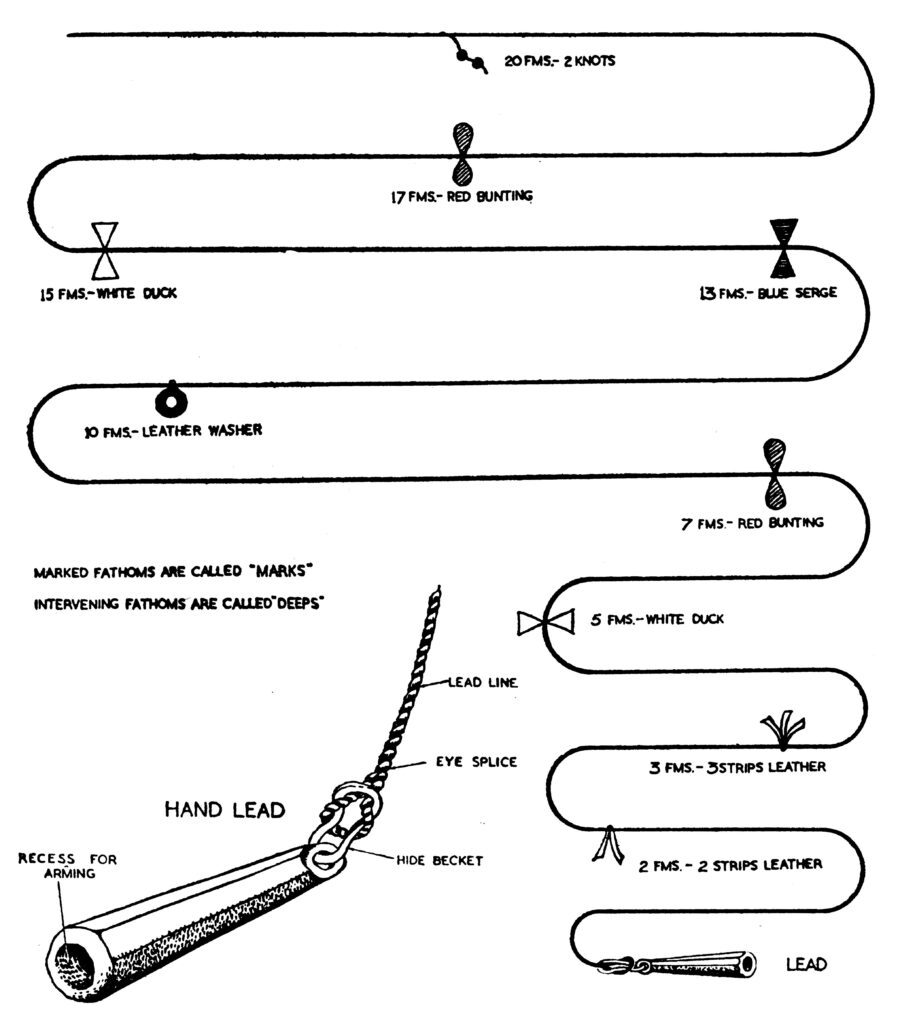
| Fathoms | Marking | Metres |
| 1 | 1 Strip if leather | 1, 11 and 21 |
| 2 | 2 Strips of leather | 2, 12, and 22 |
| 3 | 3 Strips of Leather | – |
| 5 and 15 | A piece of white duck | 5, 15 and 25 |
| 7 and 17 | A piece of red bunting | 7, 17 and 27 |
| 10 | A piece of leather with a hole in it | 10 |
| 13 | A piece of blue serge | 3, 13 and 23 |
| 12 | Two knots | 20 |
Buoyage
Buoys are used to mark channels, edges of shoals, etc. Their position is shown on the charts.
A starboard hand buoy marks that side of the channel which the main flood stream or entering a harbour from seaward port hand buoy marks the left-hand side under the same conditions.
Buoys are distinguished from each other by their shape, and topmark.
Starboard hand buoys are conical, pillar or spar in shape and painted green.
Port hand buoys are can-shaped, pillar or spar and are painted red.
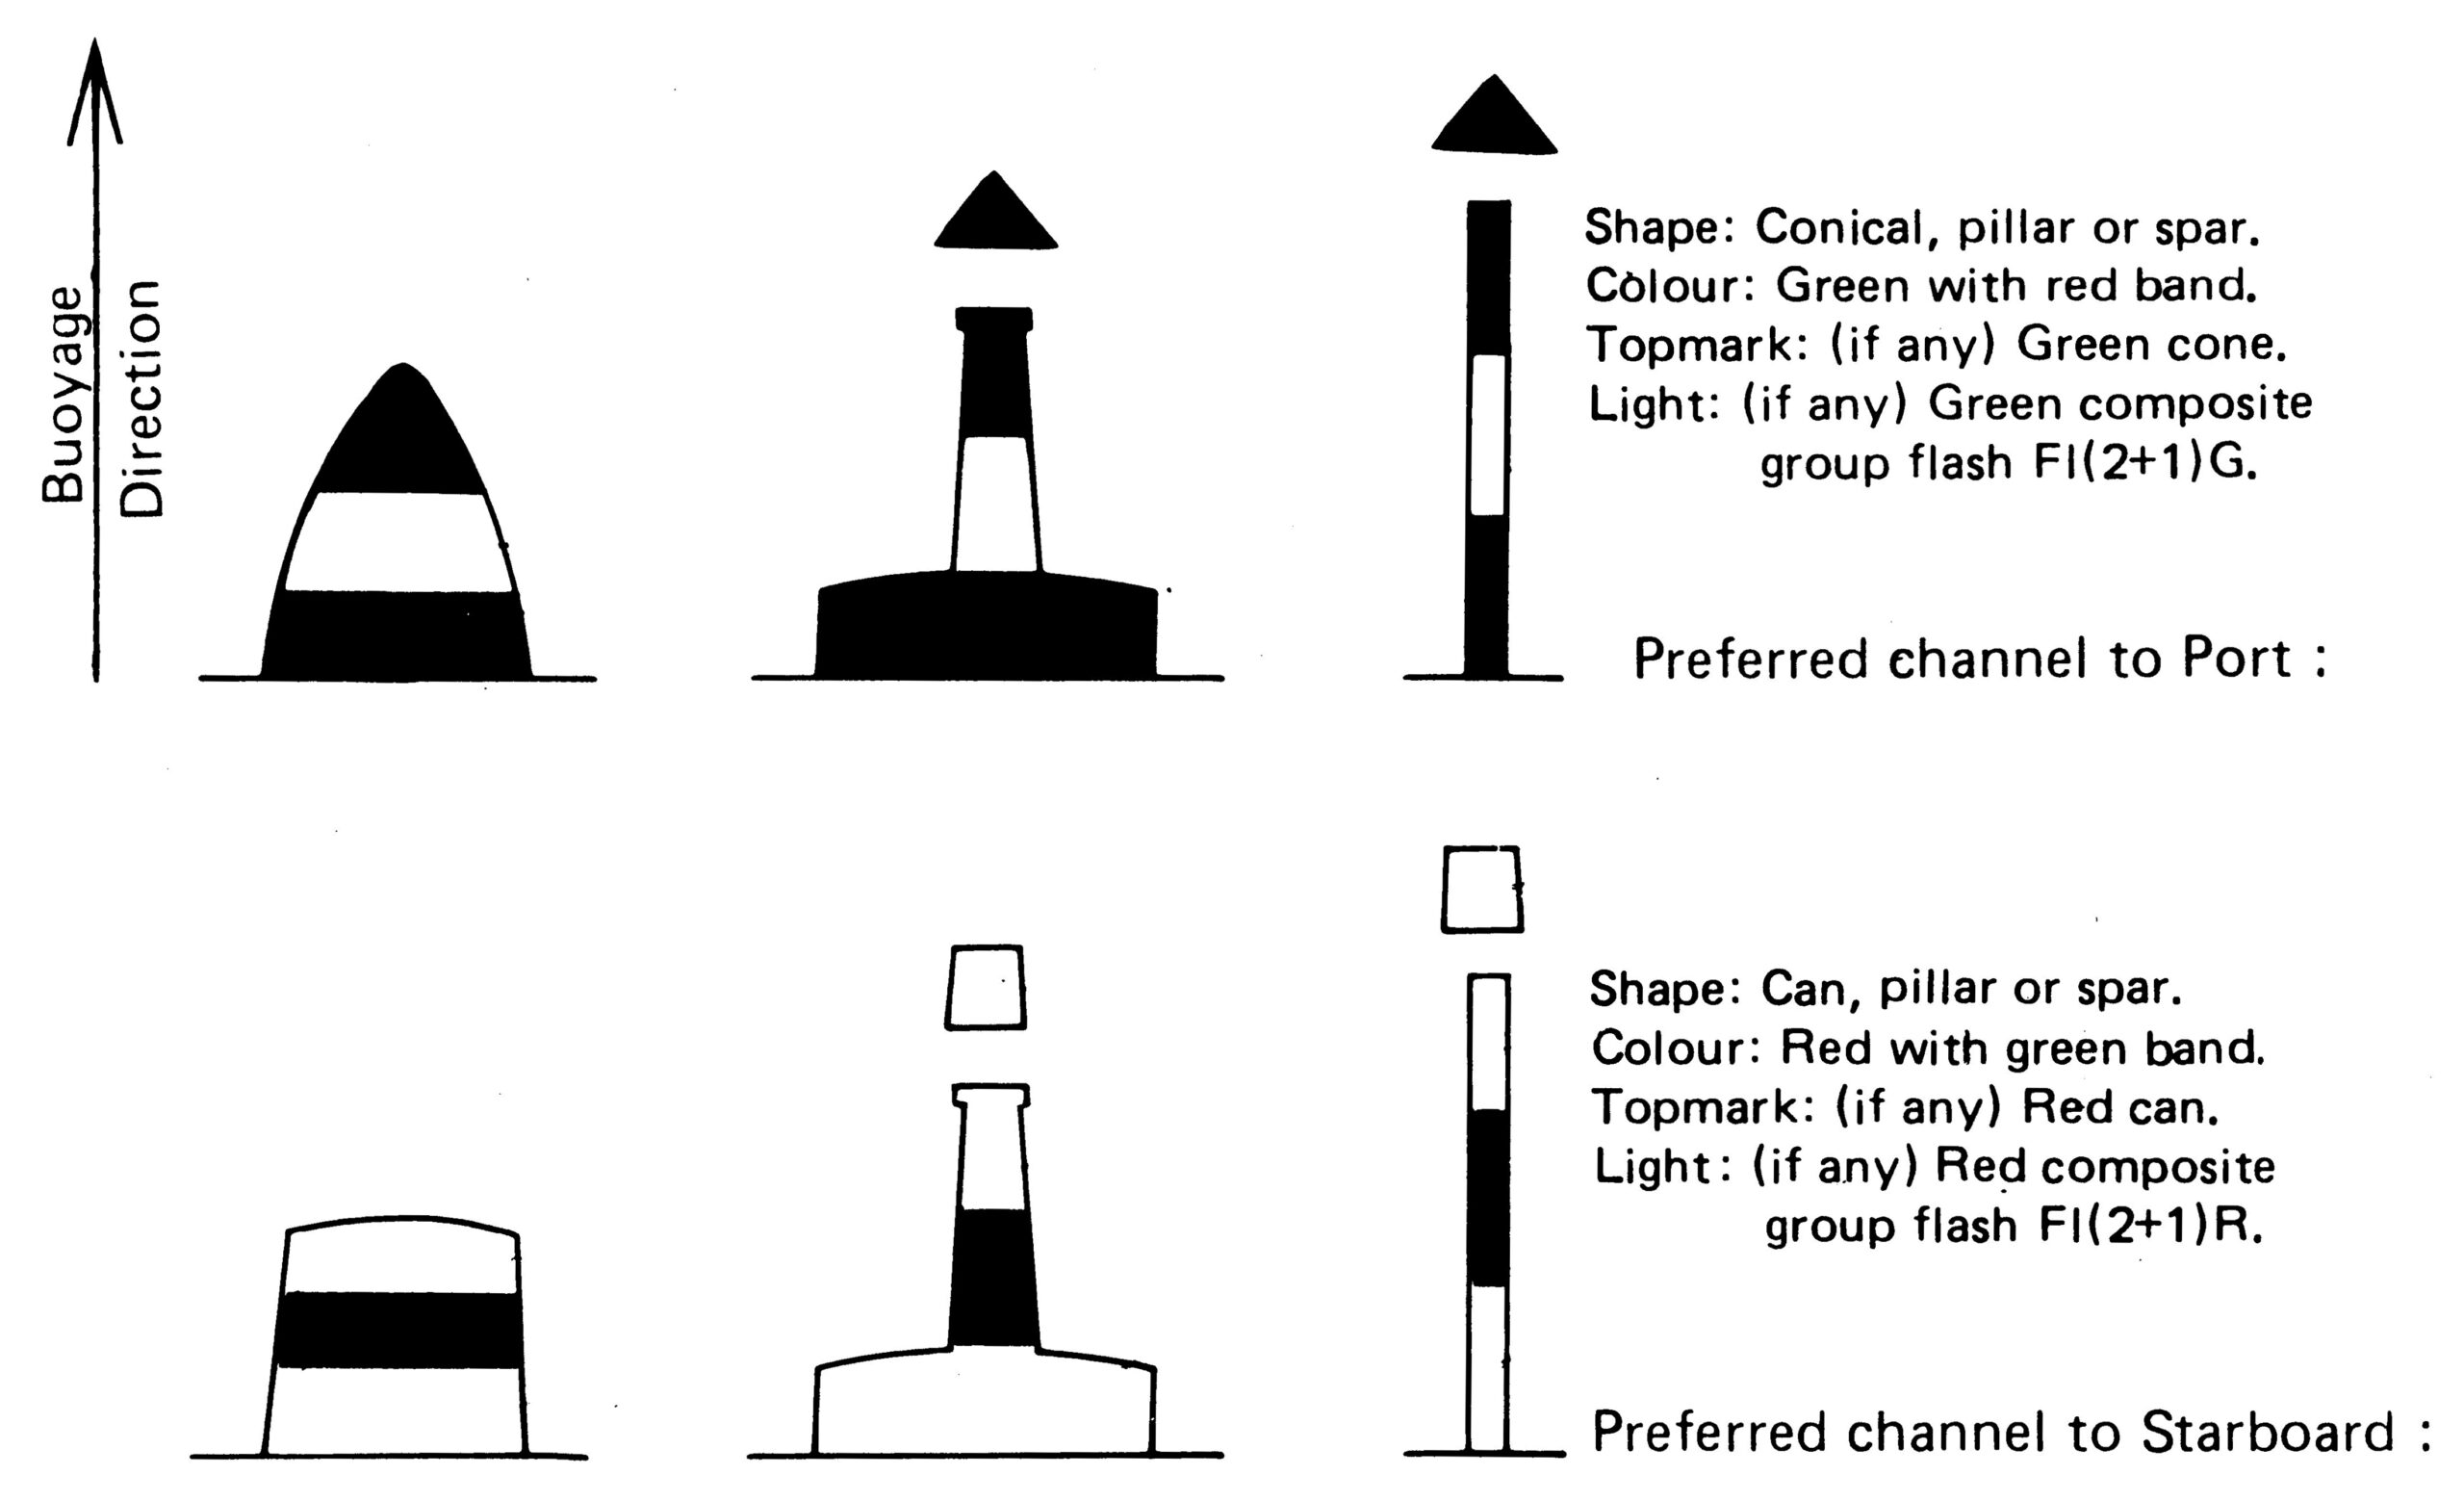
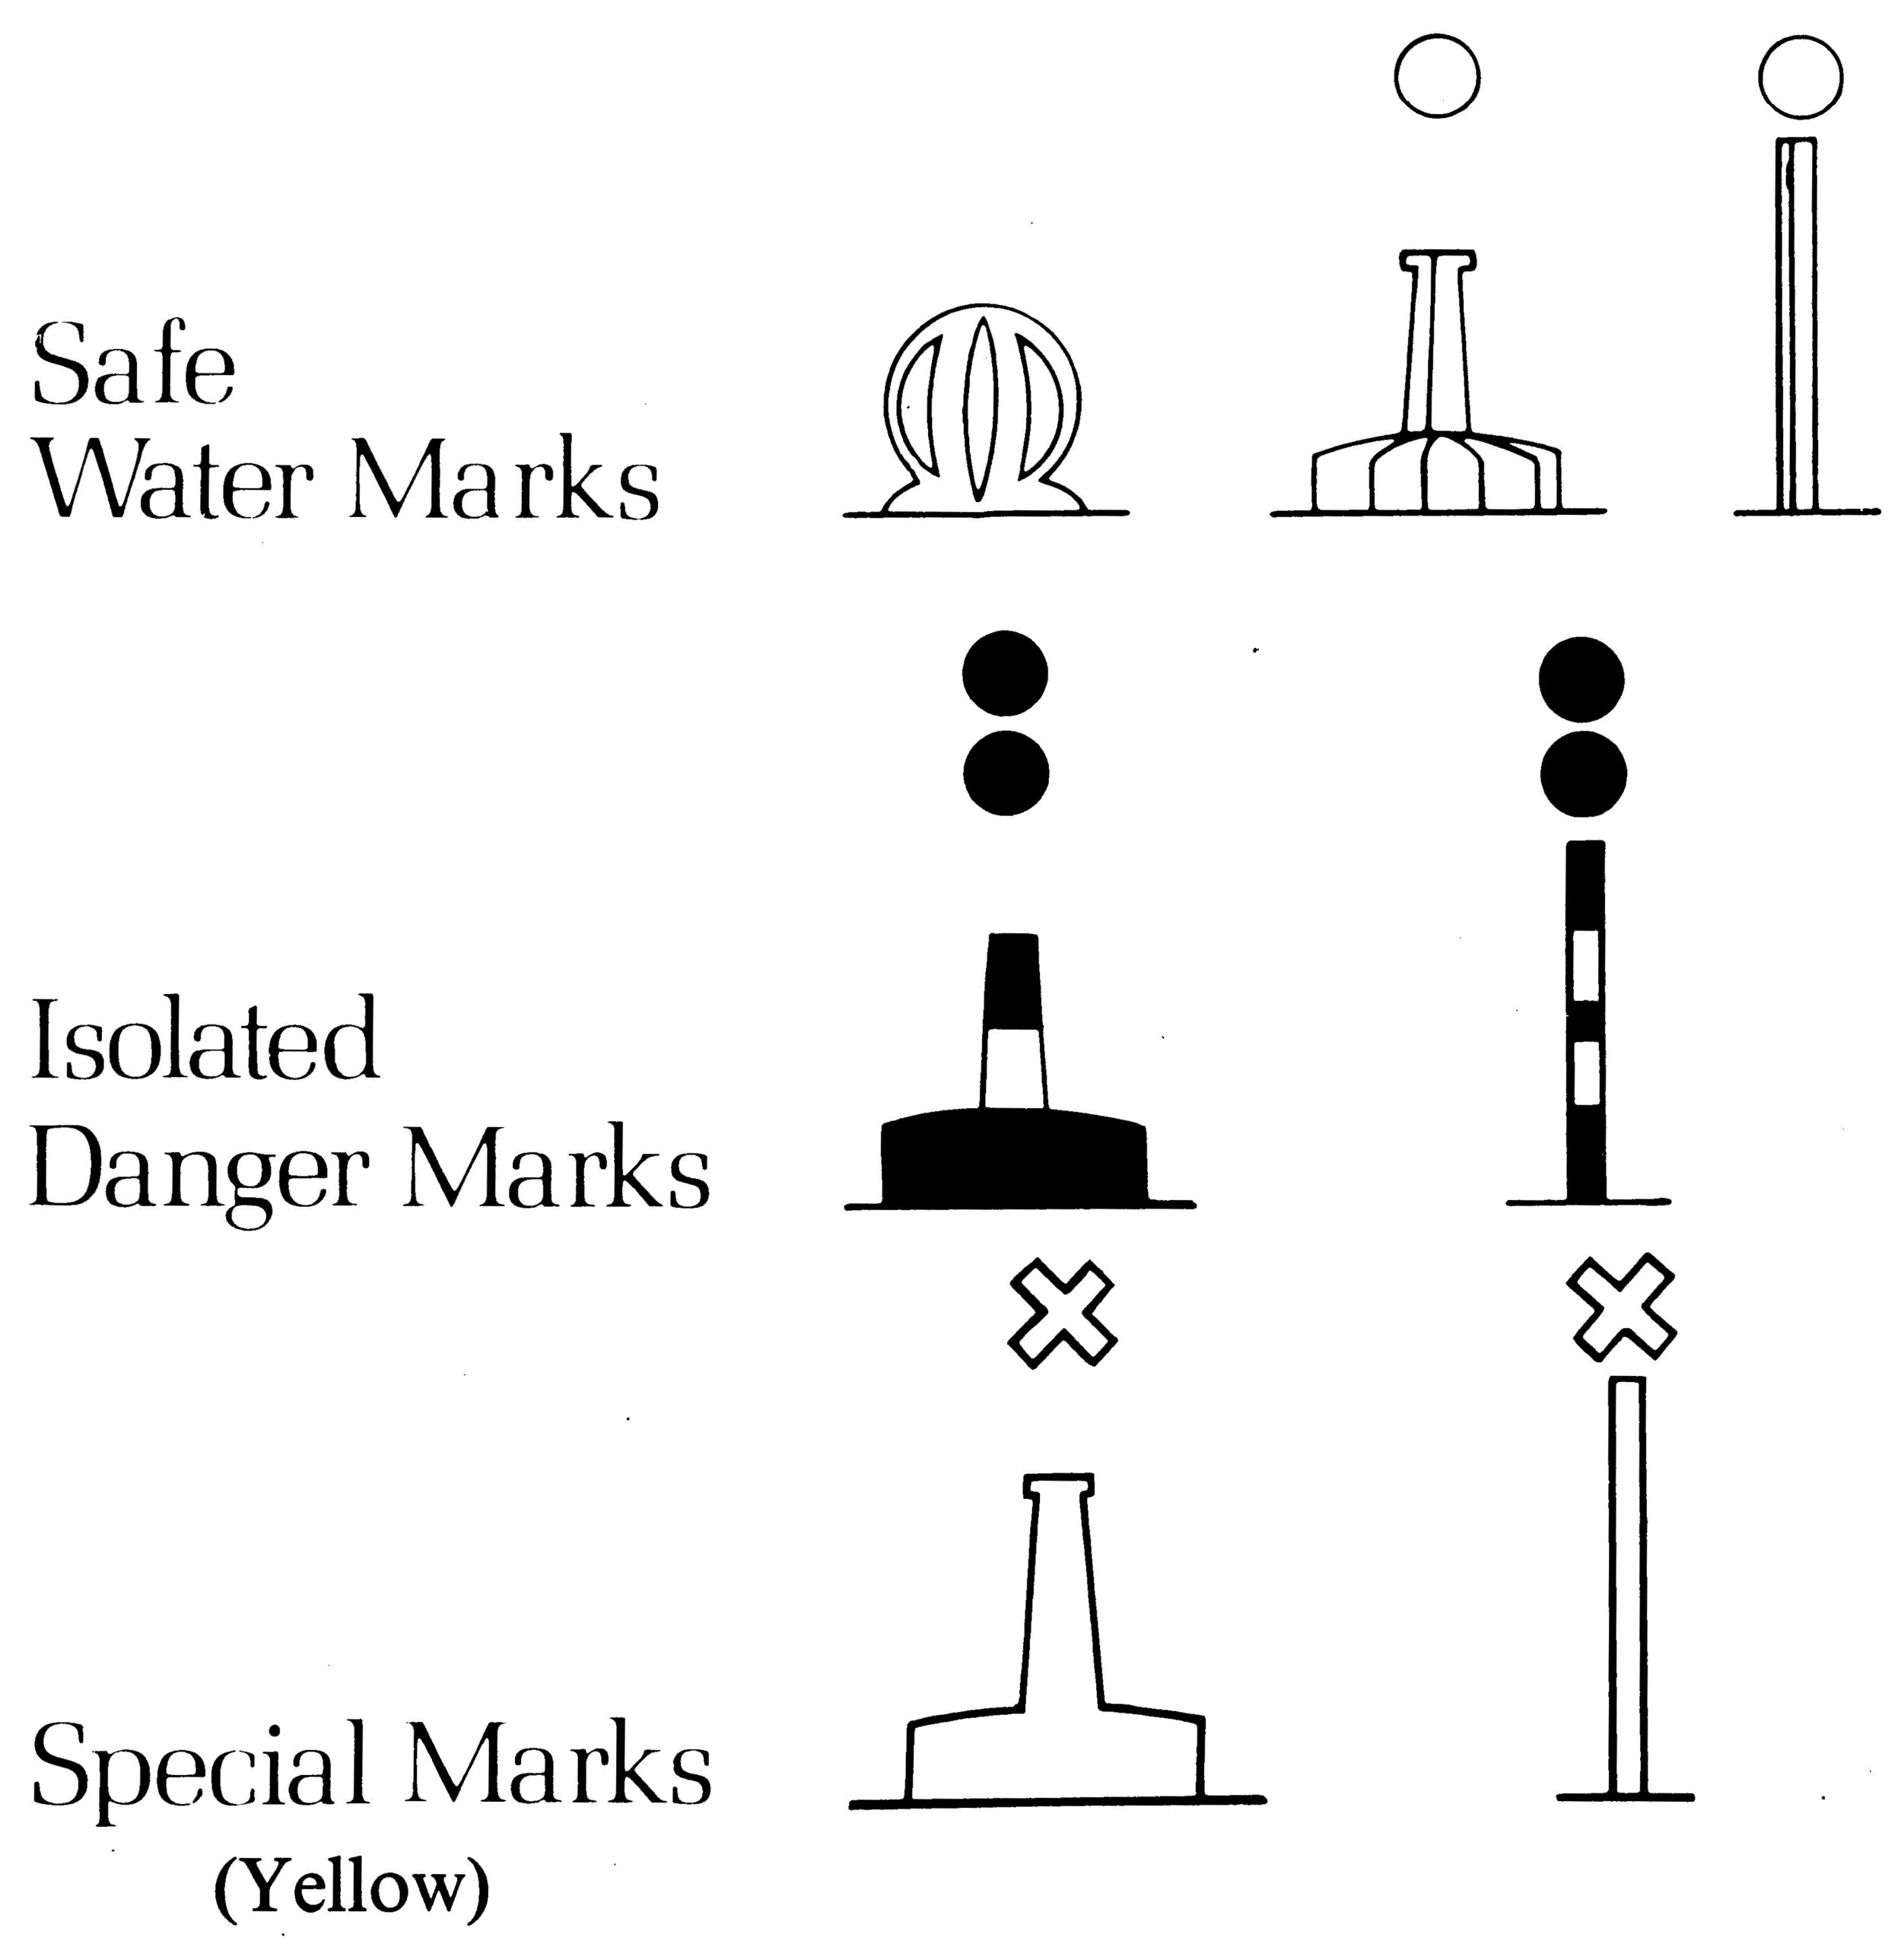
Other buoys are used to mark middle grounds, i.e., shoals in the middle of a channel, isolated dangers, safe water and special marks.
Any buoy may have a light on top, which is generally a flashing light. It is usually lit by gas and is alight day and night. Modern buoys may be fitted with an arrangement which automatically lights the light at sunset and puts it out at daybreak. Some buoys have a whistle or bell attached to them but as these are worked by the motion of the waves you will not hear them on a calm day. This is often the case during a fog. The bow waves of ships and launches however, may start them off.
Small rivers have the channel marked by small spar buoys, and sometimes branches of a tree are stuck in the mud.
Beacons are posts erected on shore with different shaped top marks to guide a ship past dangers.
Very often two beacons in line, or an object ashore in line with a beacon, guide you up the middle of a channel. These are called leading marks.
Lights or lighthouses are placed to mark salient features of the coast and hidden dangers such as rocks and shoals. They are lit from sunset to sunrise and are used for fixing the position of a ship at night.
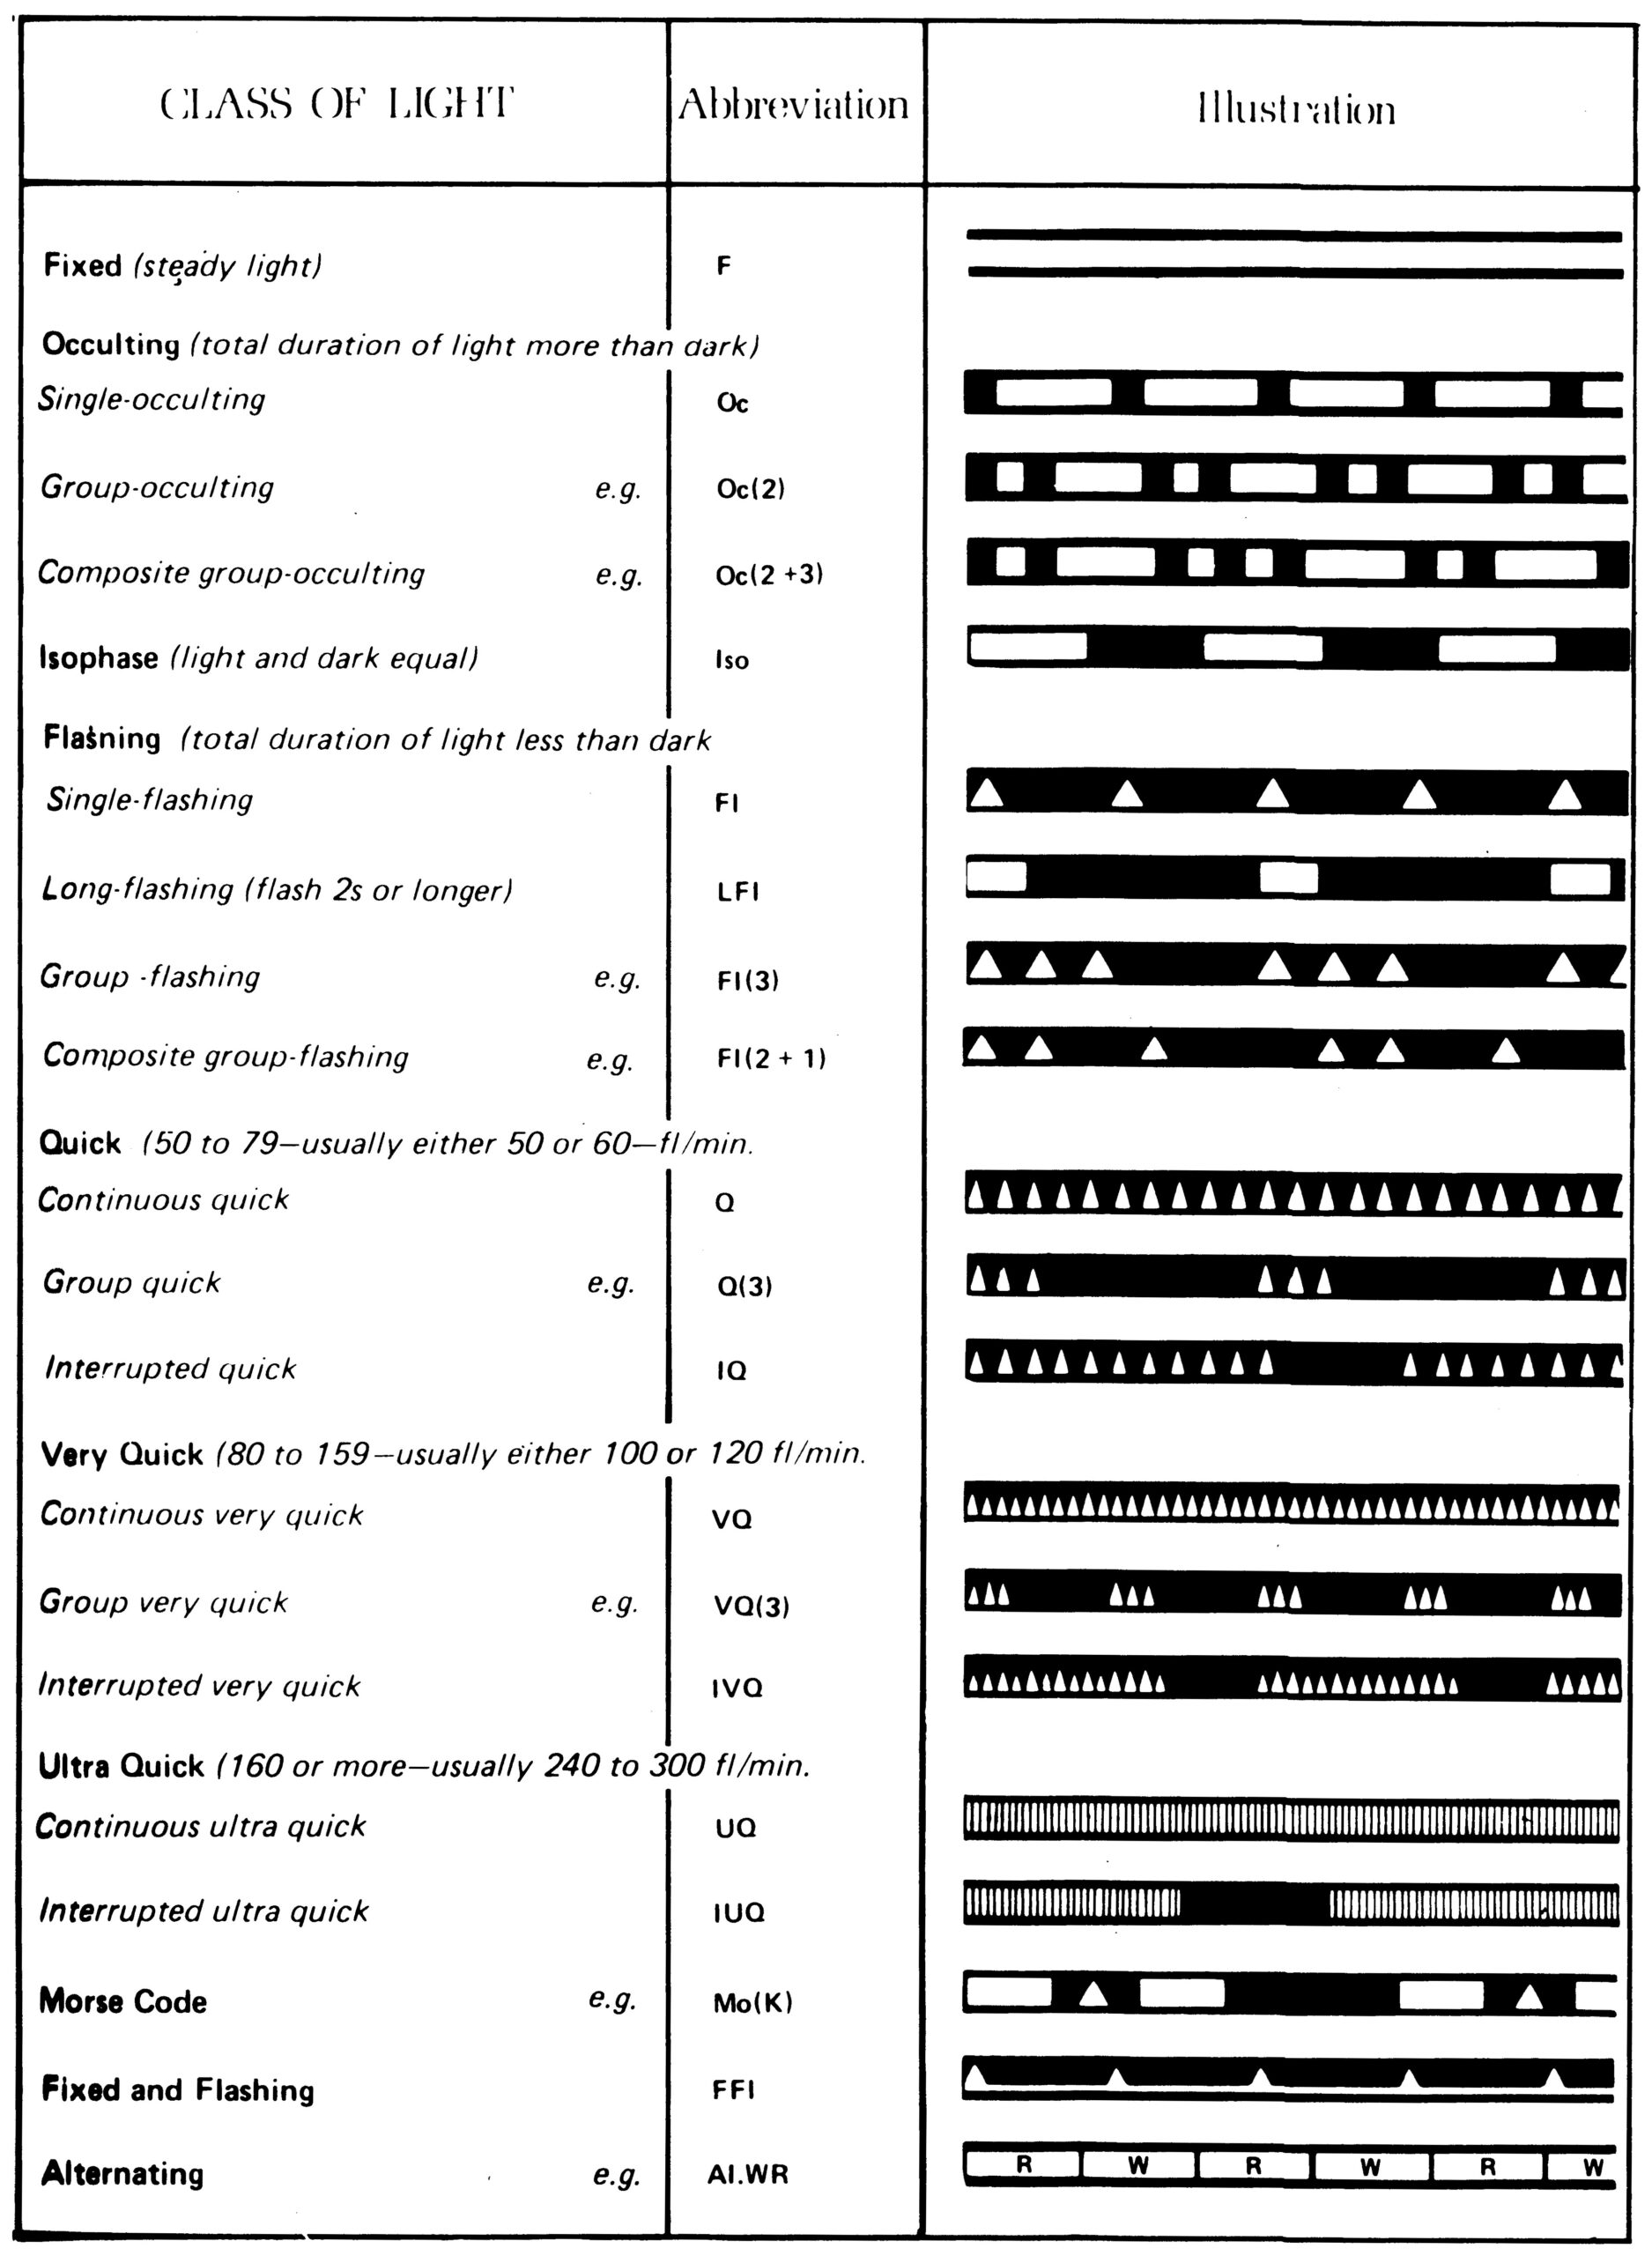
Light Characteristics
Lateral Marks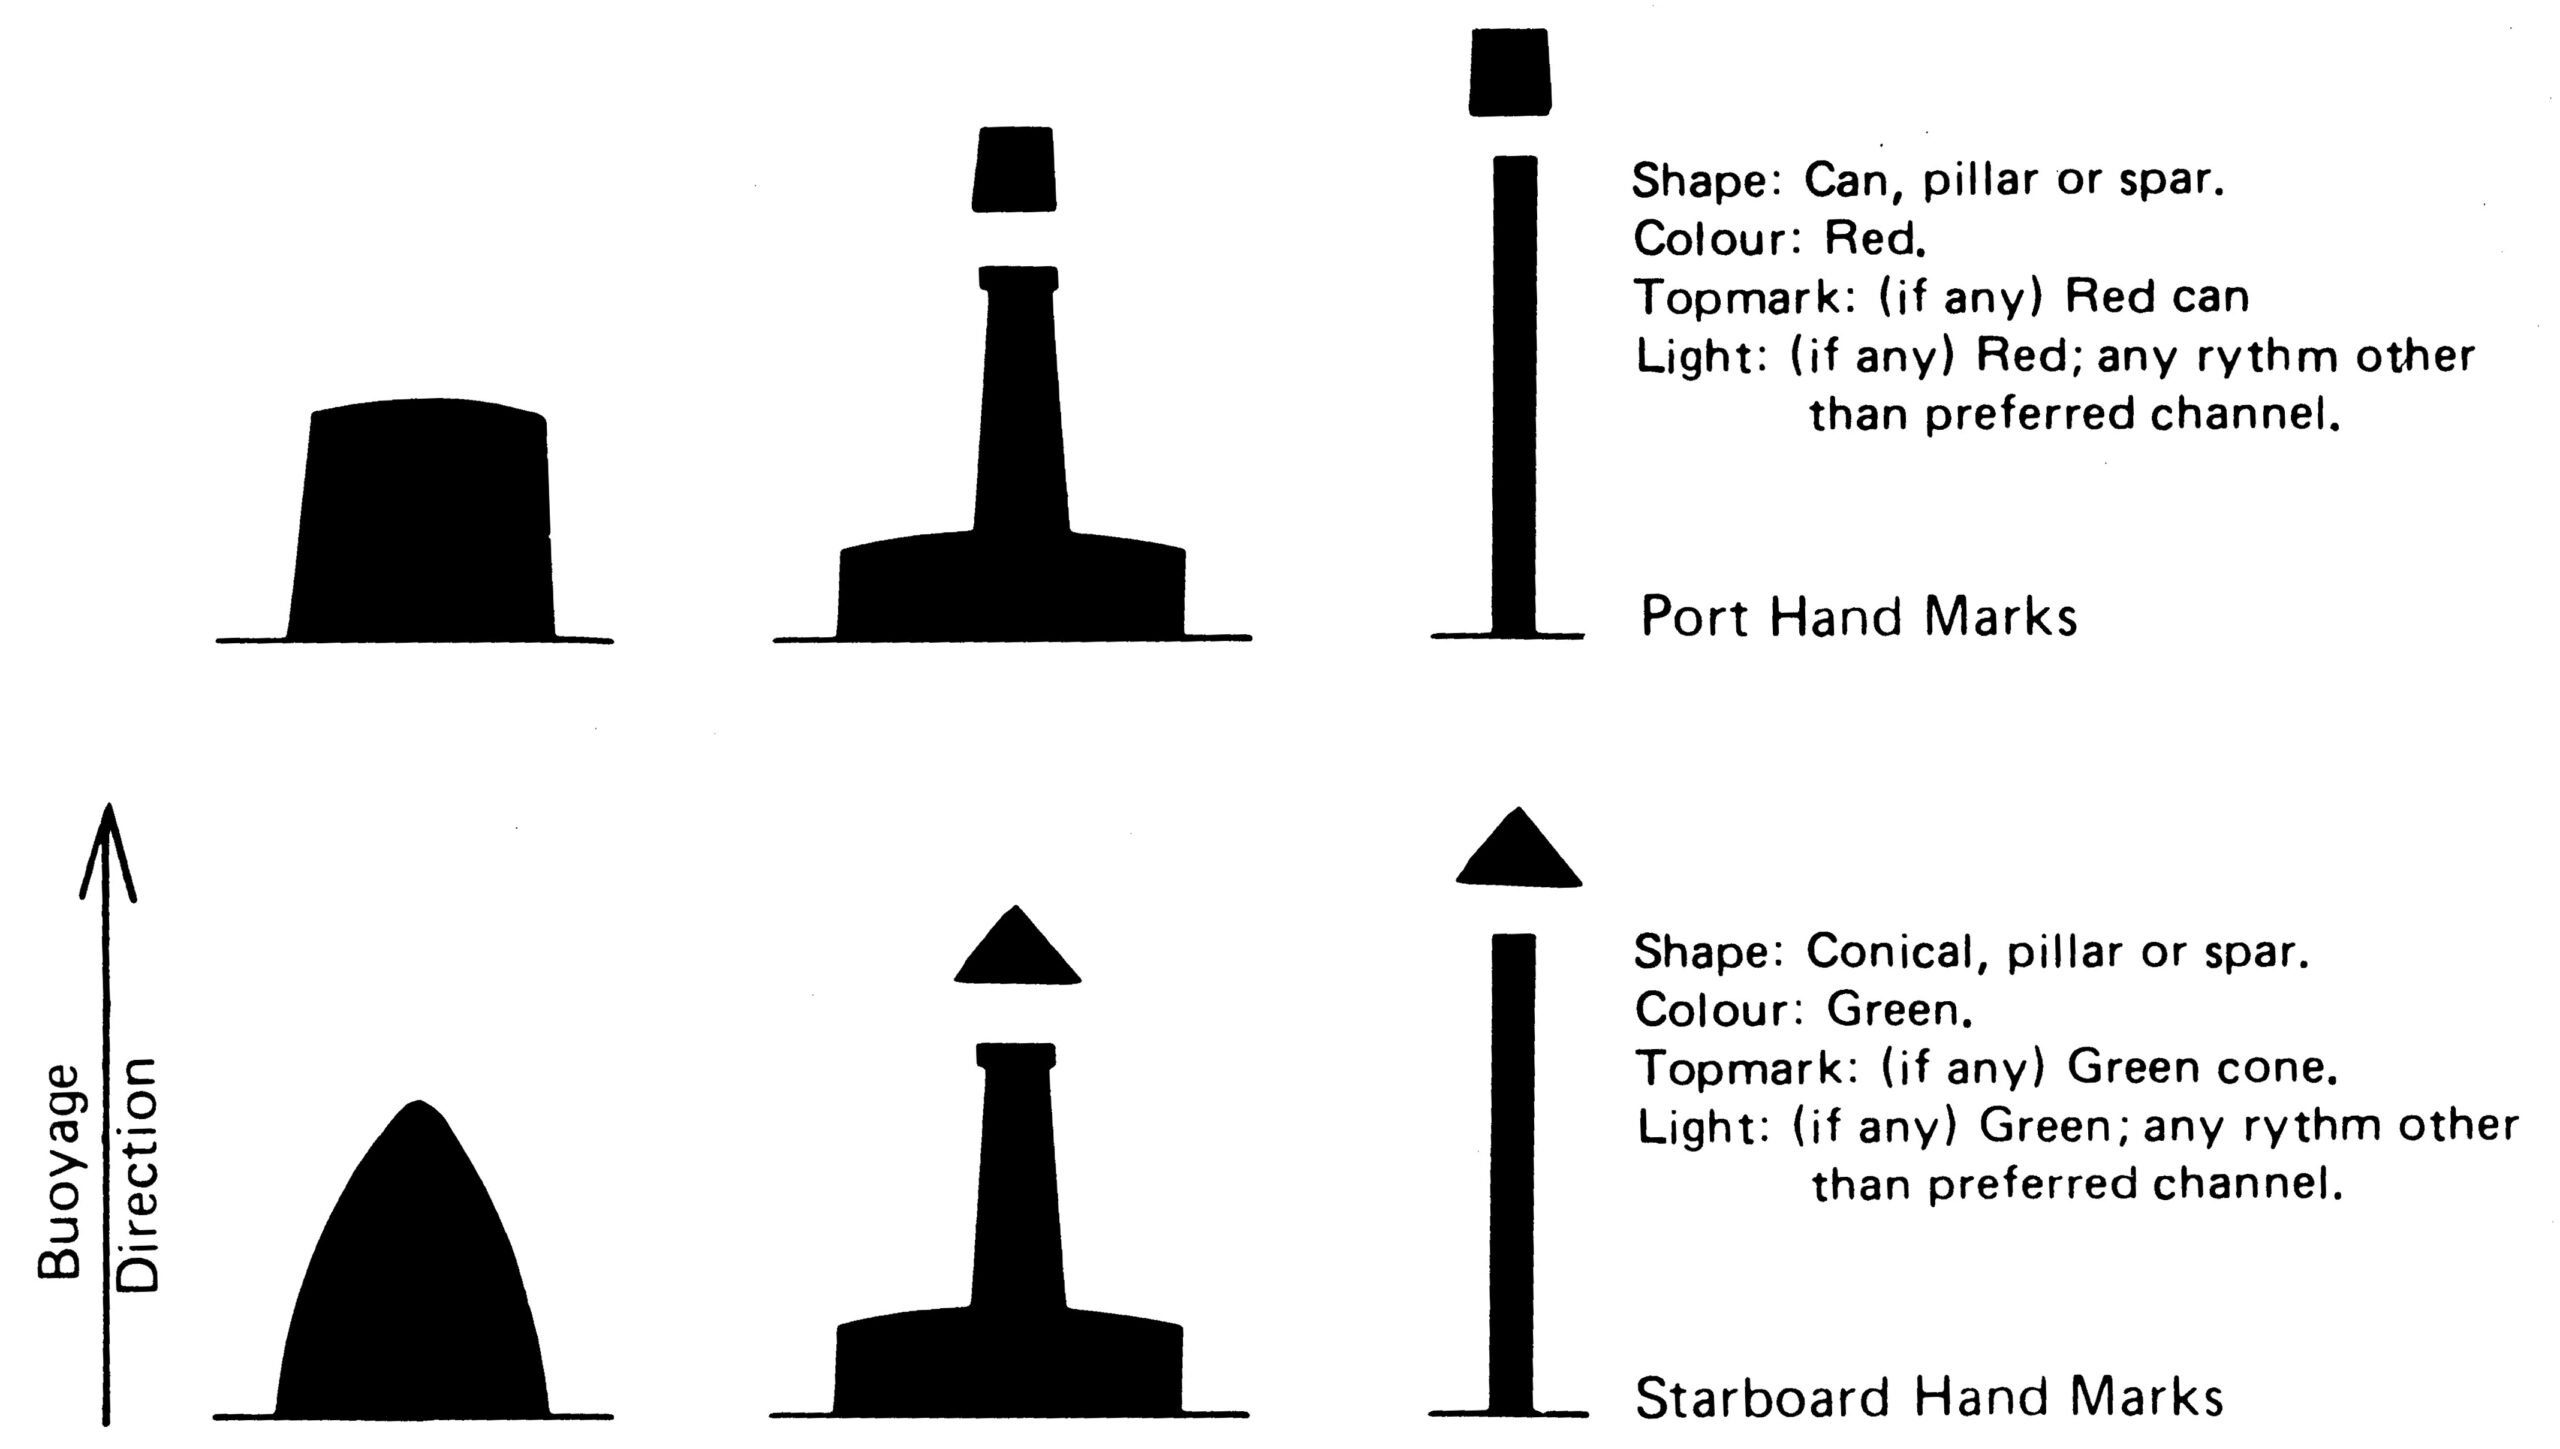
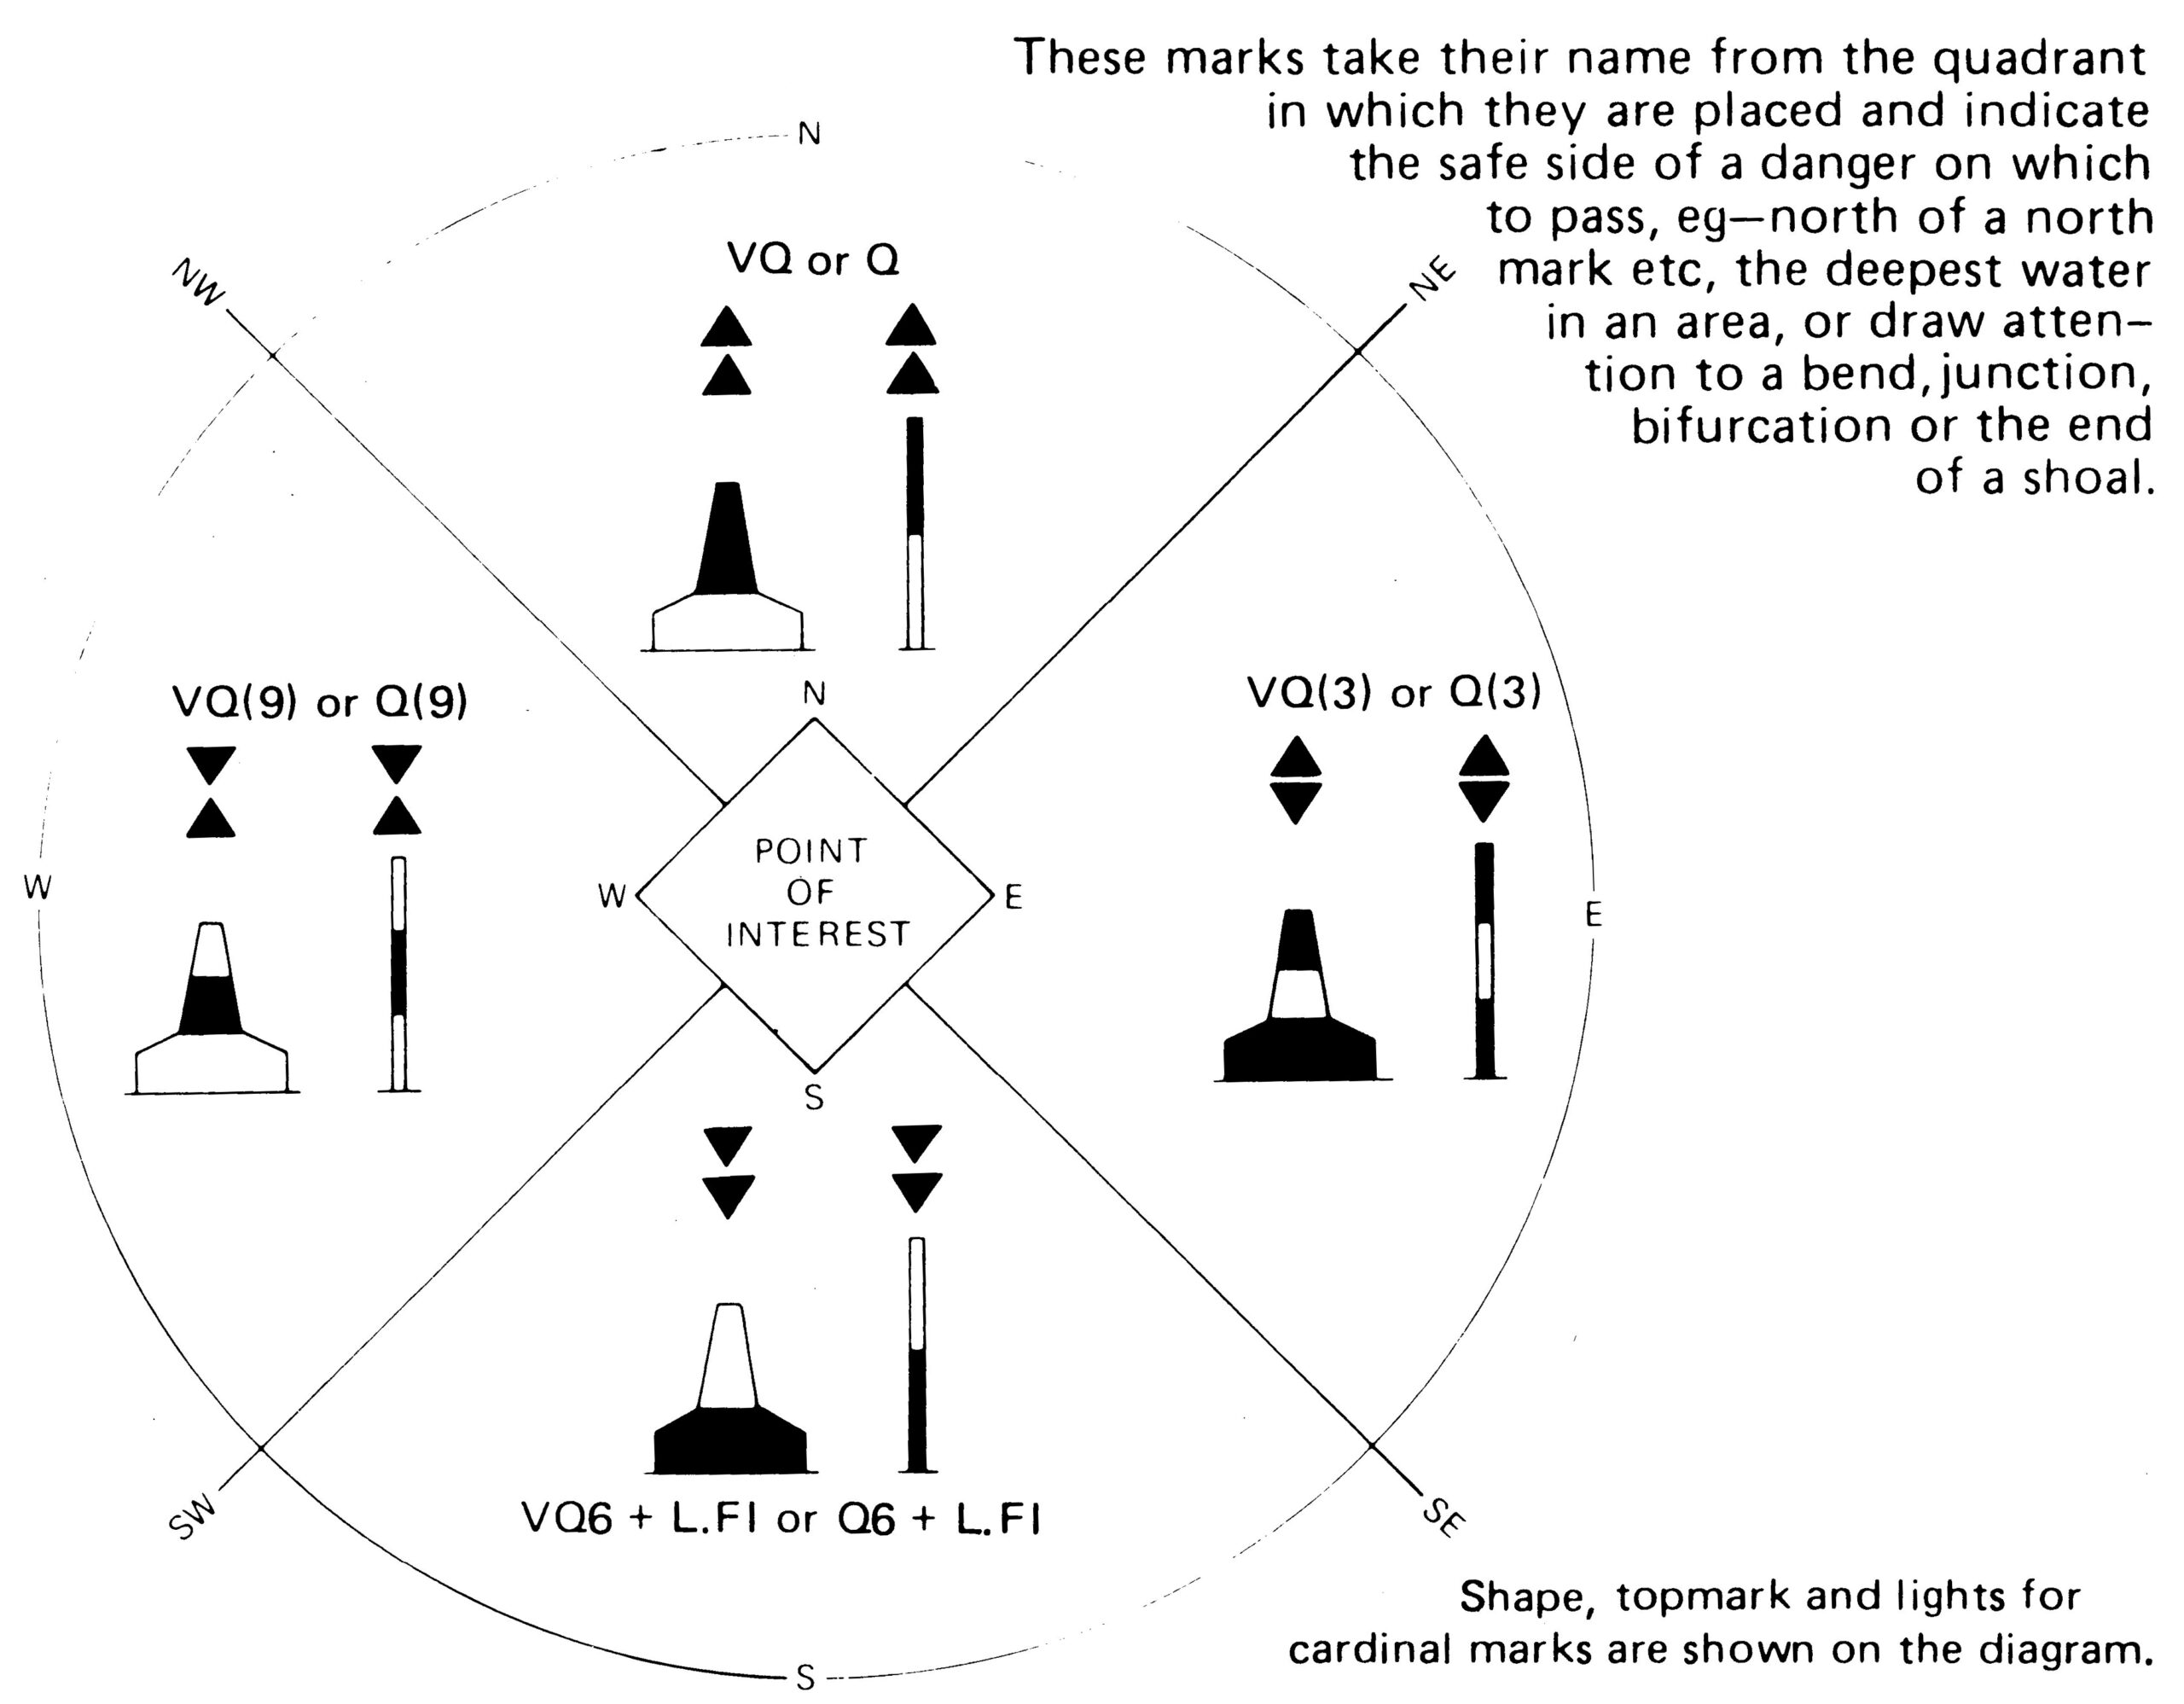
 Cardinal Marks
 Meteorology
Forecasting the weather with reasonable accuracy is within the limits of anyone prepared to make intelligent use of available information which includes daily weather maps published in newspapers and the more frequent radio forecasts.
Adding individual expertise to forecasts makes good sense. Often, observers can detect significant local changes not covered in the more general forecasts. At times, this knowledge could well avert a crisis or help plan the next day’s cruise.
Study Elements
Three elements for Sea Scouts to observe are the clouds; atmosphere pressure changes and wind direction and strength. Seven of the ten basic cloud formations are derived from three major types.
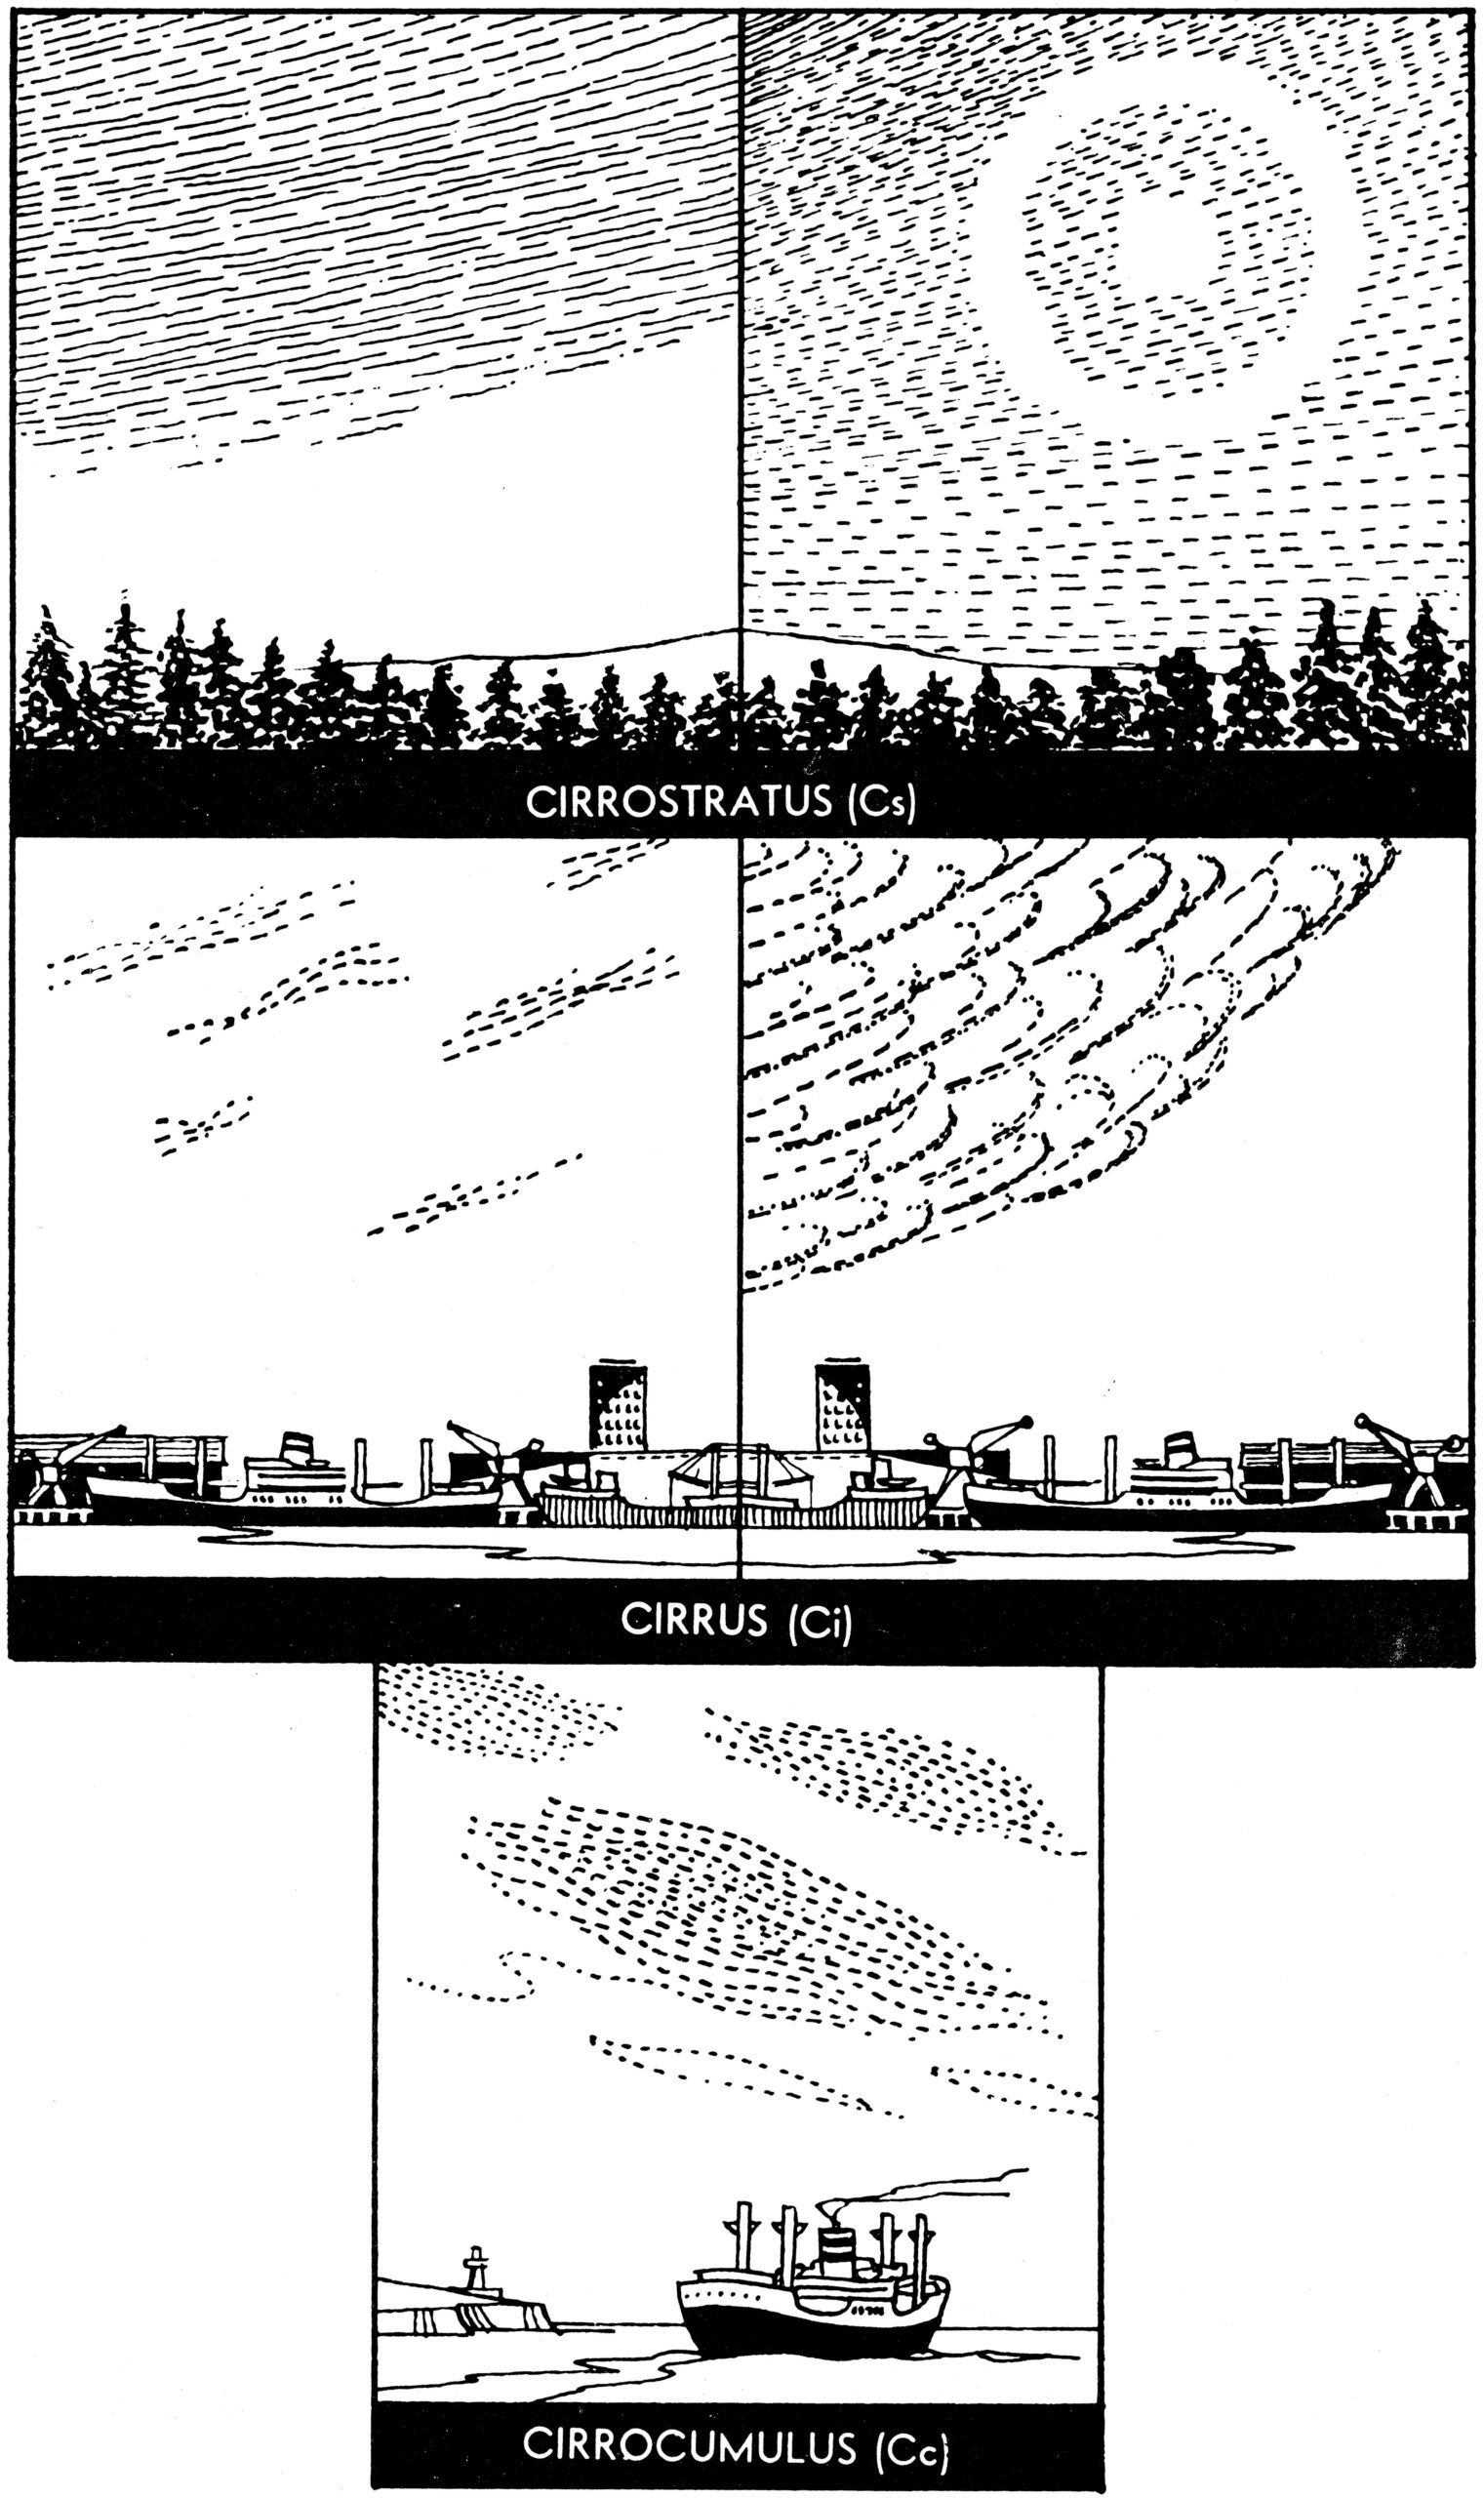
They are stratus, Latin for layer, which are sheet clouds indicating stability; cumulus, pile or heap cloud, which are unstable; and cirrus, which are hair or streak-like in appearance.
Cirrus clouds which are streaky and sometimes resemble mares tails indicate continuing fine weather unless thickening into cirrostratus.
Cirrostratus clouds are layers covering the sky and the first hint of bad weather. Tell-tale sign is a halo around the sun or moon.
Altostratus clouds are layers through which the sun or moon can often be seen in hazy form. As a development of cirrostratus, they once again give warning that bad weather is approaching.
Rain is imminent when nimbostratus clouds form. They are thick lower clouds which have evolved from cirrostratus and altostratus. As can be seen from the preceding paragraphs the various formations gradually develop into tangible shapes which clearly indicate what weather to expect.
Fine Weather
Cirrocumulus, which are normally associated with cirrus clouds, portend continuing fine weather unless there is any substantial increase of cloud.
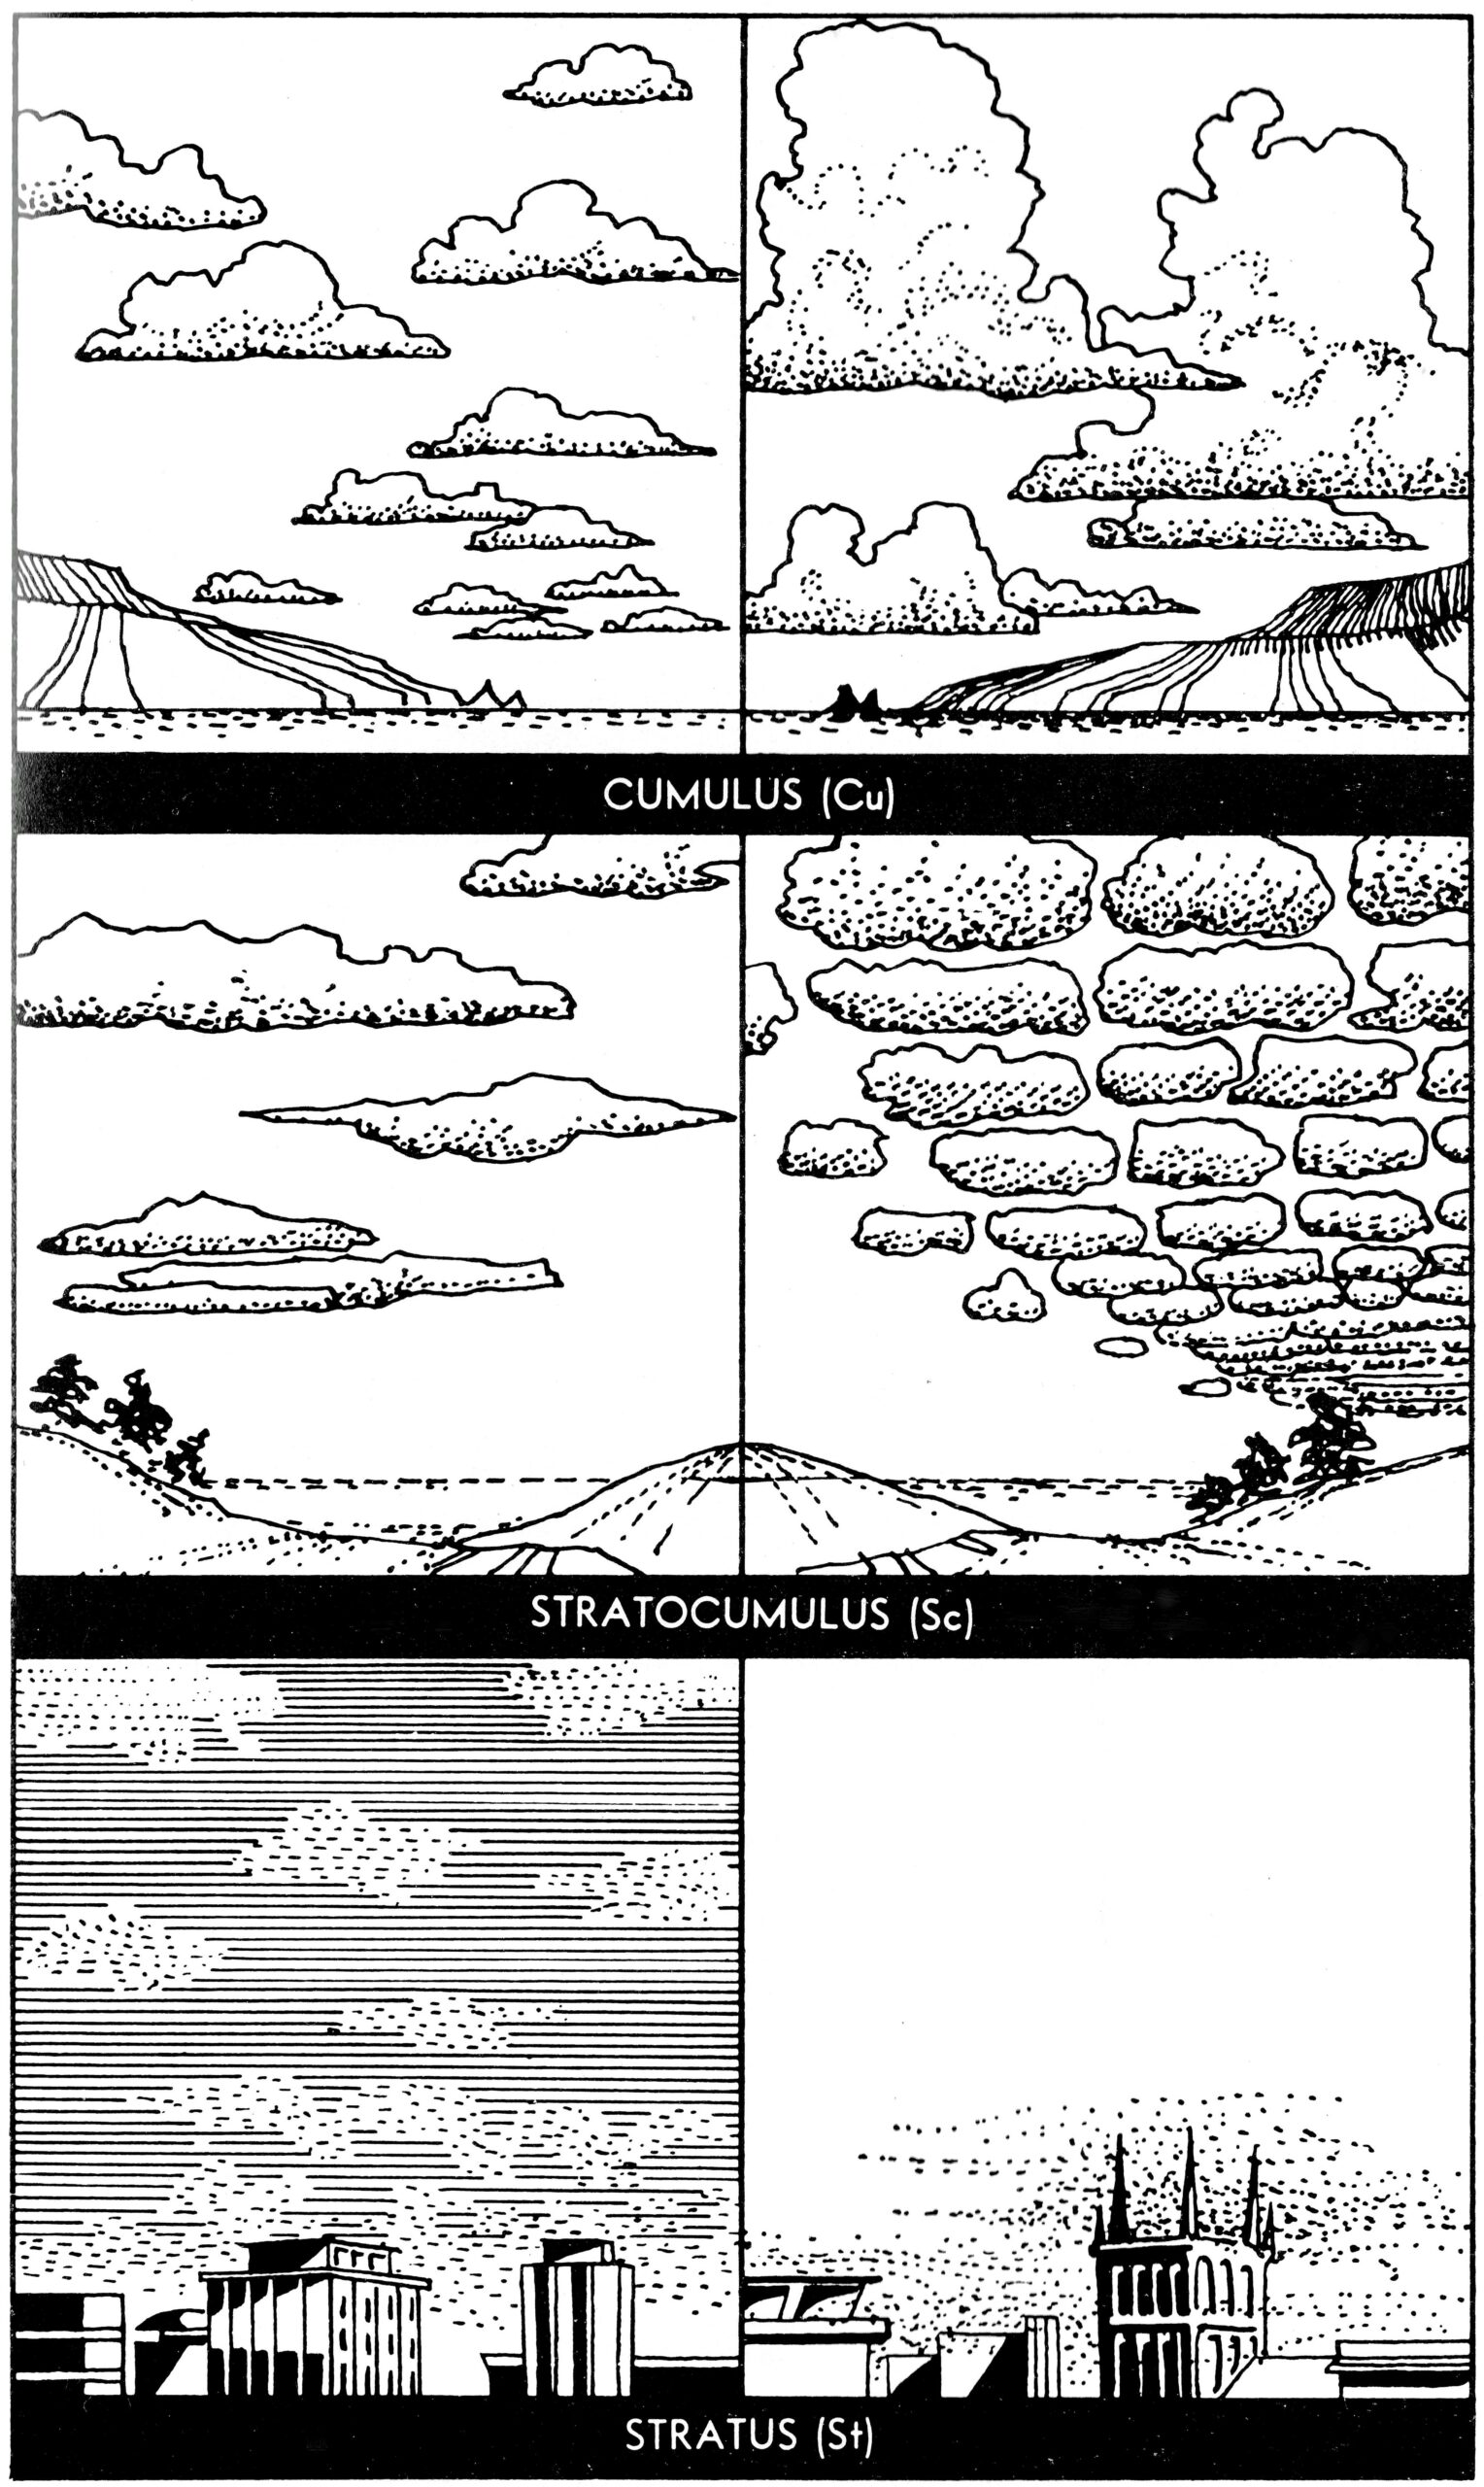
Cumulus, heap clouds resembling cotton wool are most common of all and welcomed as good sailing weather. Such clouds indicate anti-cyclone conditions.
Stratocumulus are cloud formations which denote atmospheric stability. At this point of development, such clouds are not thick enough to produce rain.
Cumulonimbus are extreme formations which, if shaped in vertical forms herald thunderstorms, hail and squalls. Quite often cumulonimbus clouds are shaped like an anvil —a result of violent updrafts. Dispersal of the anvil is the death-knell of the storm.
Stratus are low lying clouds of no particular form very much like fog. Drizzling light rain often accompanies such clouds.
Altocumulus or billowy clouds, at medium level, mean fine weather unless they thicken.
Sea Scouts are wise to suspect conditions allowing for perfect visibility, often a sign of unstable elements. On the other hand, hazy weather usually indicates stable conditions.
Pressure
New Zealand and its surrounding waters are blessed in summer with regular high-pressure systems or anti-cyclones, generally bringing fine weather. They are indicated by a rise in the “glass”. Anti-cyclones usually move from west to east and are frequently accompanied by southerly winds which decline to light and variable and change to northerlies when the centre of the anti-cyclone has passed.
This is the case if the centre passes the observer, but if it is to the north or south there will be variations in these wind directions as it moves across, these can be deduced from a study of the weather map. It must be remembered that the wind goes anti-clockwise in an anti-cyclone following the lines of the isobars on the map. The exception being for local variations which only long experience in a locality can give the ability to foretell.
Low pressure systems or depressions often bring high winds and rainy unpleasant weather. They too usually pass eastwards over New Zealand and are termed cyclonic moving in a clockwise direction. From a study of the map the most likely wind direction can again be deduced.
Tropical cyclones originate north of 20 degrees south and usually travel south or south eastward near New Zealand bringing gale force winds and heavy rainfall. These low-pressure systems are characterised by the widespread lifting of the air which gives rise to extensive thick layers of clouds. Only about two or three such cyclones a year hit New Zealand.
CLOUD TYPES HIGH LEVEL
CLOUD TYPES MEDIUM LEVEL
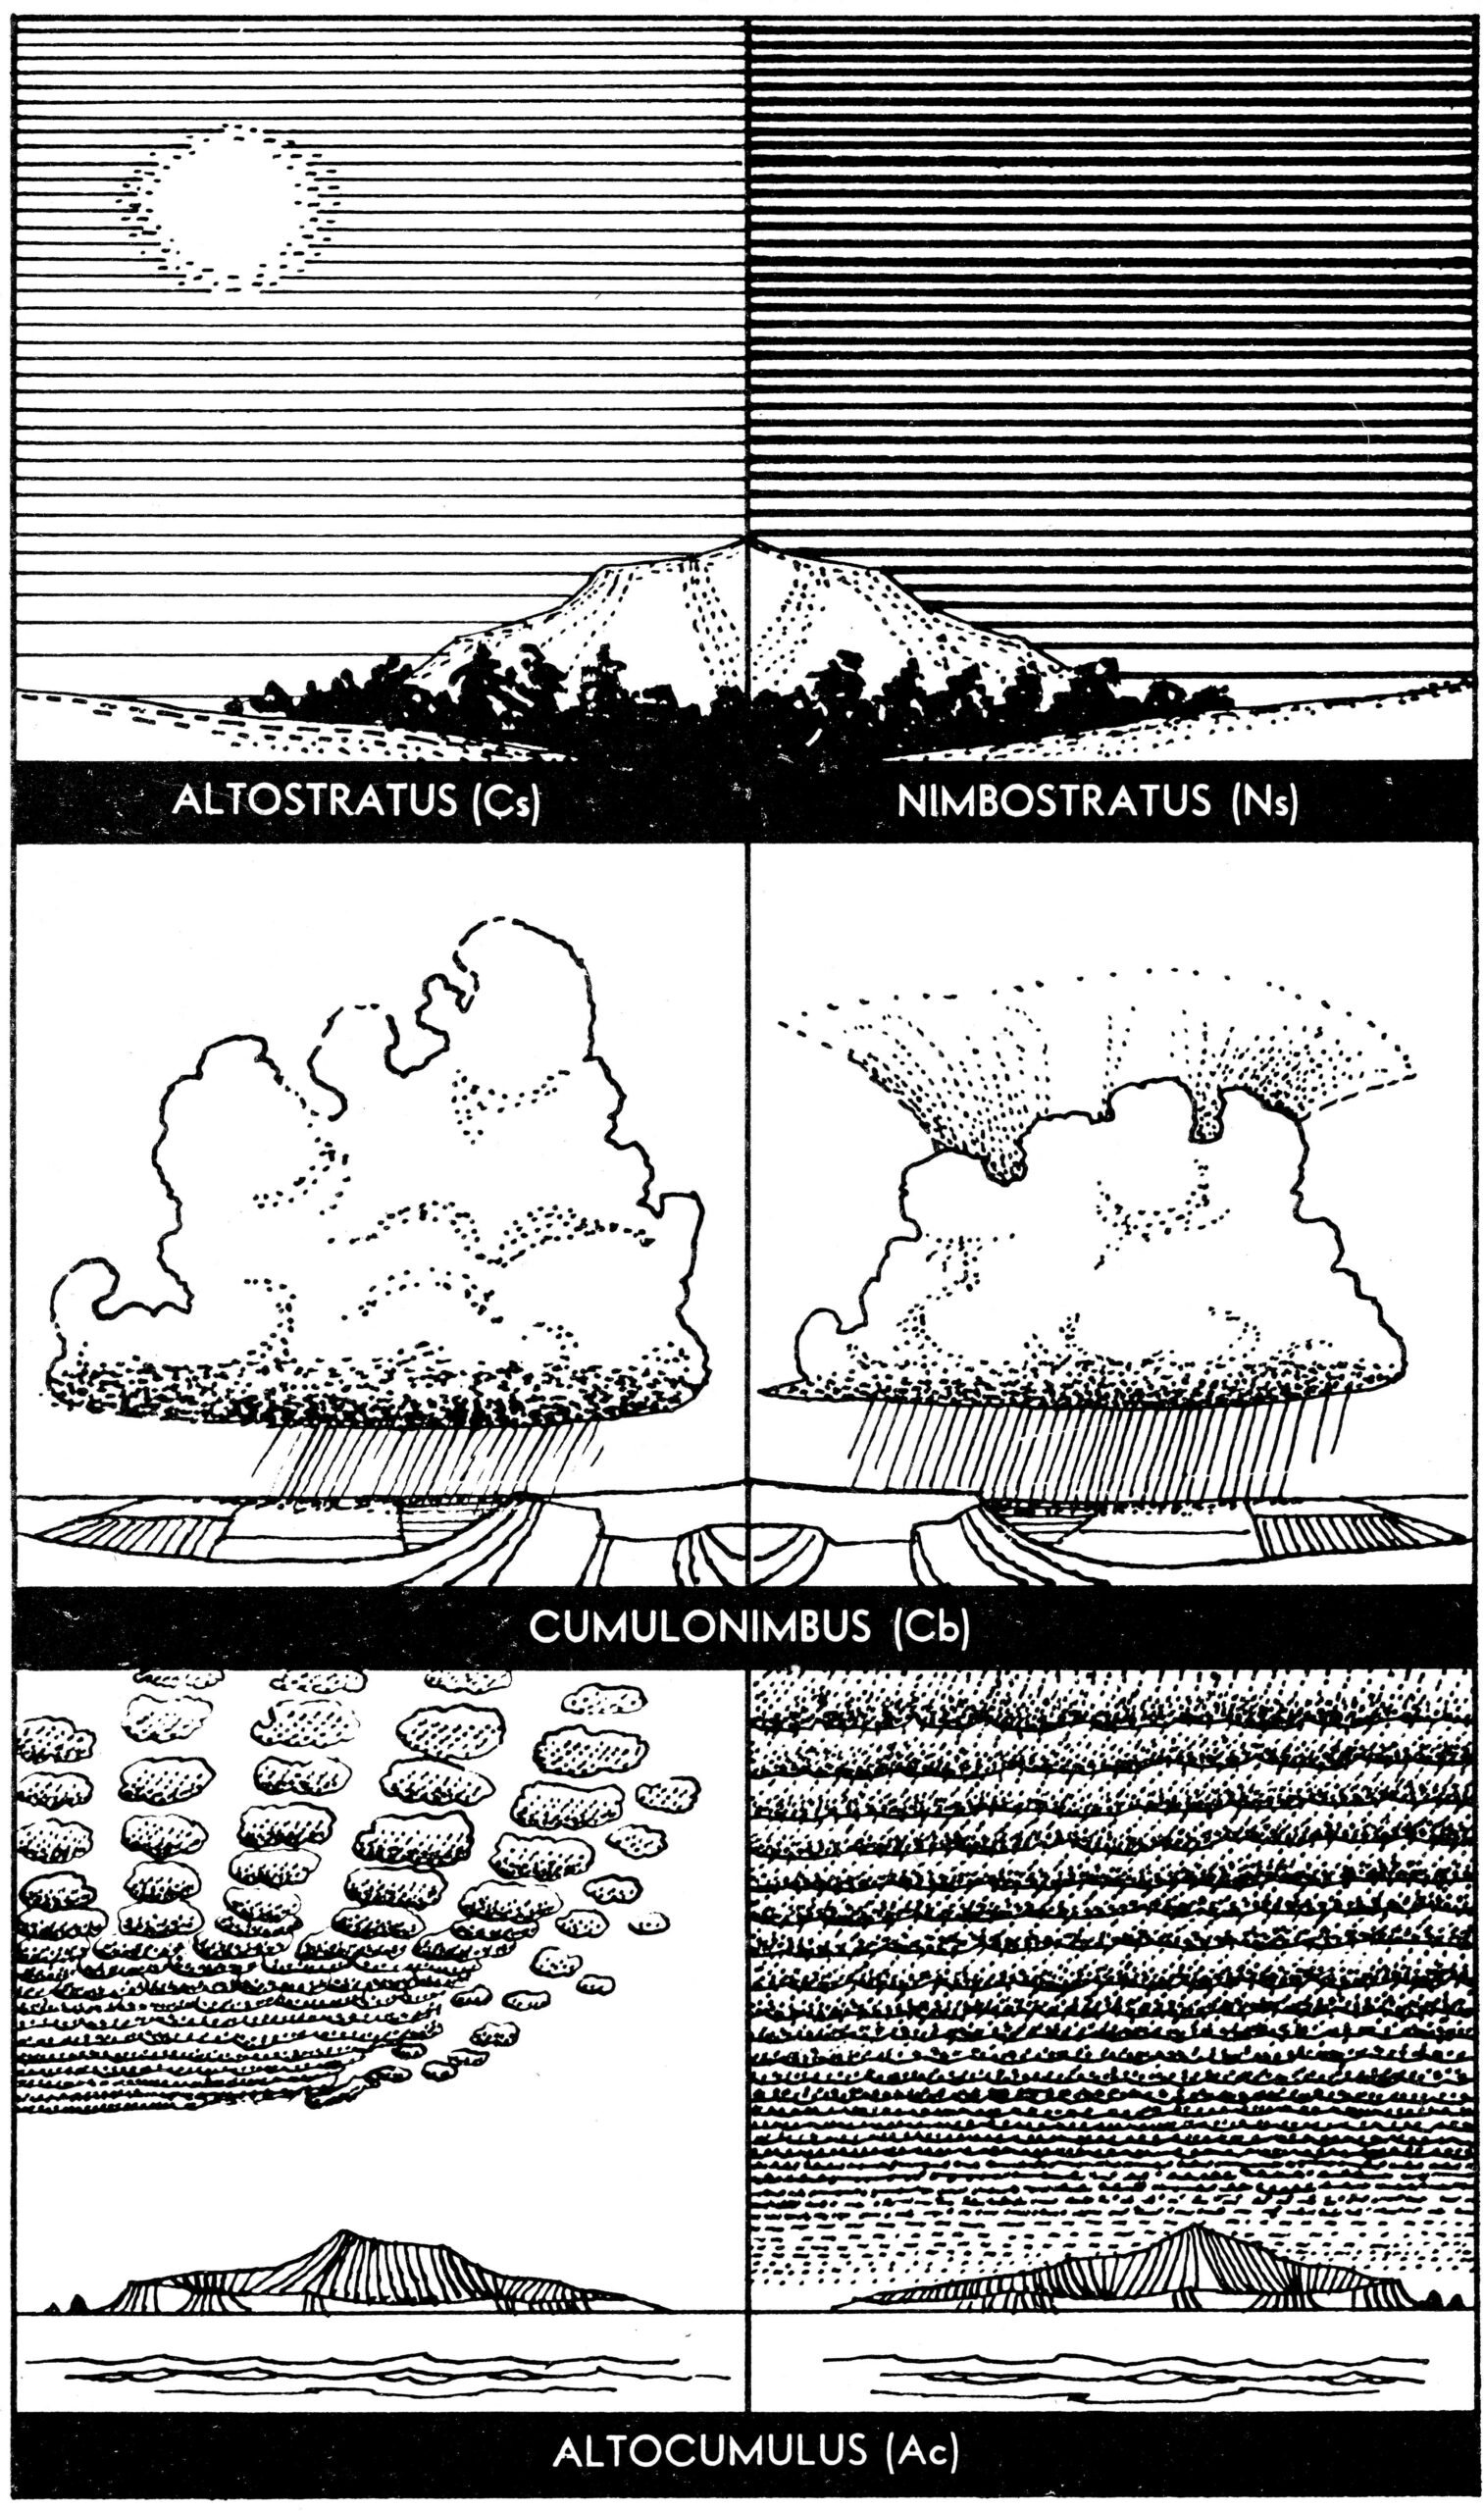
CLOUD TYPES LOW LEVEL
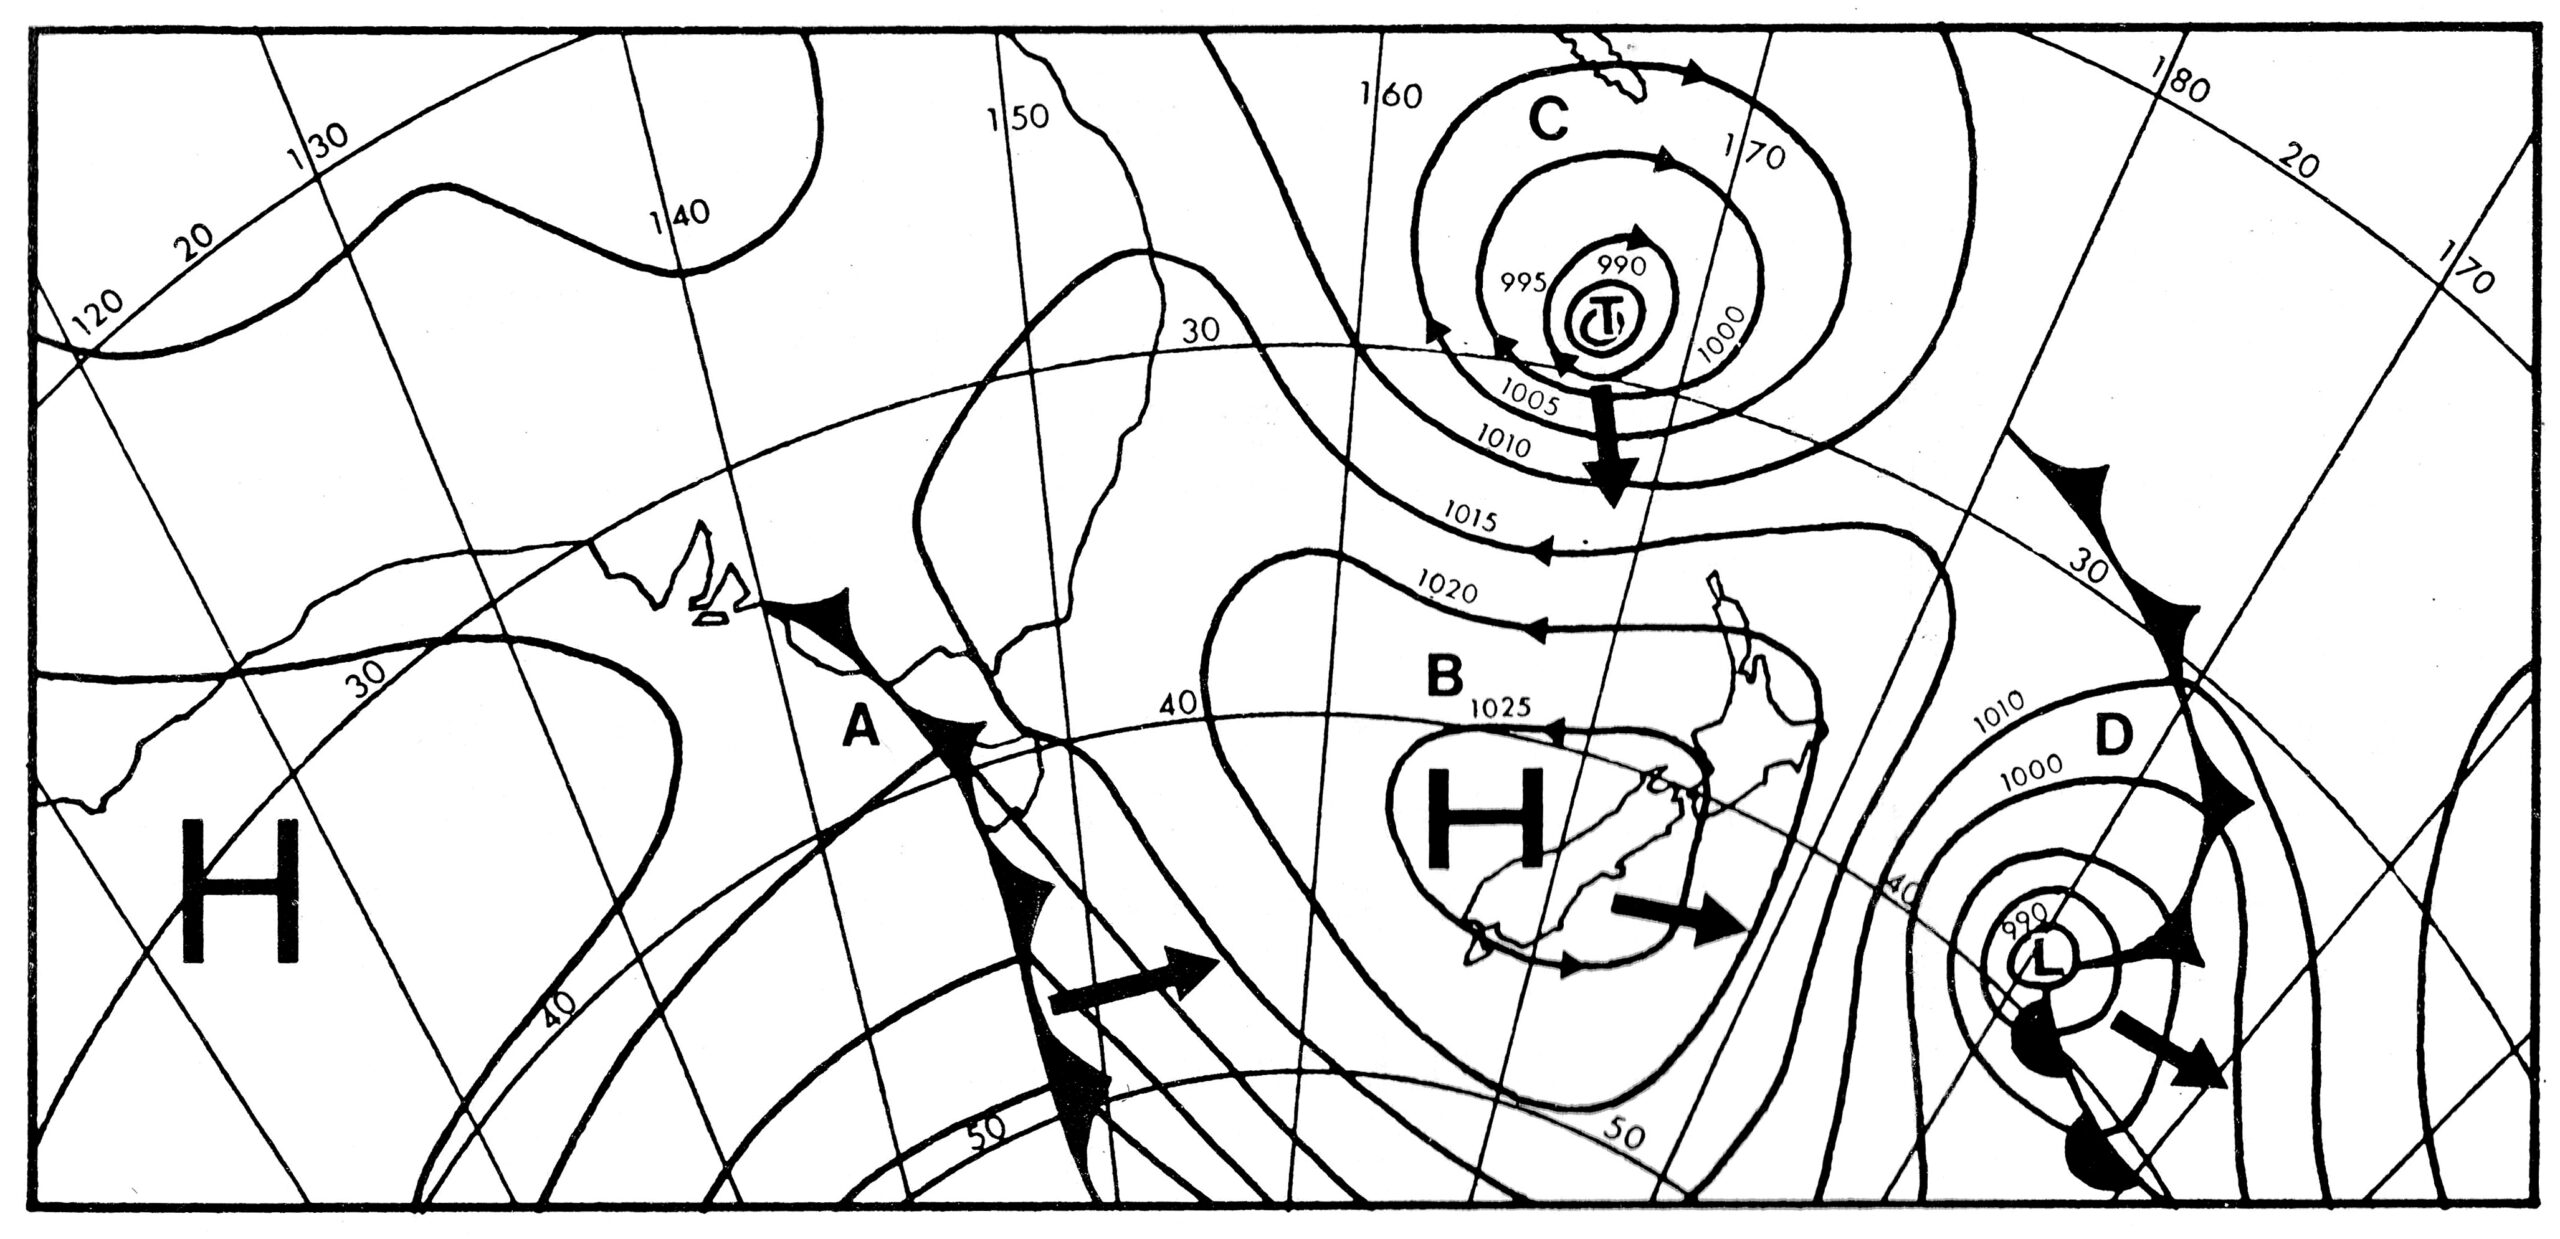
The following weather map shows several typical pressure systems and associated fronts passing through the area affecting New Zealand’s weather. The general movement is always from west to east as the big arrows show.
A is a cold front crossing Tasmania and moving on to the south Tasman.. It will probably be closely preceded by northerly winds and rain with a change to west or sou’west winds as the front passes, with heavy showers gradually clearing to fine weather as the high behind it moves over.
B is an anti-cyclone moving across New Zealand with the centre of highest pressure over the South Island. This should bring fine weather to most of the country. The winds follow the direction of the arrows—in an anti-clockwise direction in an anti-cyclone. They are easterly in the far north and westerly in the far south and light and variable in the centre of the South Island. The big distance between the isobars—which show the barometric pressure—shows that the pressure gradient is not very steep, so winds generally will be light.
C is a tropical depression or cyclone moving down from the north but tending to join the general movement and swing away to the east. The isobars are closer together and show a steeper pressure gradient and stronger winds. As it approaches New Zealand it will give strong to gale force easterlies in the north but will probably move off the country or dissipate without affecting the weather very far south. The arrows indicate the direction of the wind —in a clockwise direction round a cyclone.
D is a frontal depression moving away from New Zealand, with a cold front extending northwards and a warm front to the south-east of the centre of lowest pressure. This is a fairly complex system and would give unsettled weather.